
laradock+phpstorm 开启 xdebug
300 / 0 / 创建于 4年前 /
 stonelalala 的个人博客
最近在学L05的电商教程,前面基本都不需要debug,看到支付宝回调这边,遇到点问题,想看一下回调中返回的串解析出来的数据。之前一直没配置debugg,记录一下怎么开启。
-
编辑laradock的.env文件
查找:WORKSPACE_INSTALL_XDEBUG
将原本的值false改为true
查找:PHP_FPM_INSTALL_XDEBUG
将原本的值false改为true -
编辑workspace和php-fpm的xdebug.ini文件
这边直接贴一下我的配置
workspace的xdebug.inixdebug.remote_host=host.docker.internal xdebug.remote_connect_back=0 xdebug.remote_port=9000 xdebug.idekey=PHPSTORM xdebug.remote_autostart=0 xdebug.remote_enable=1 xdebug.cli_color=0 xdebug.profiler_enable=0 xdebug.profiler_output_dir="~/xdebug/phpstorm/tmp/profiling" xdebug.remote_handler=dbgp xdebug.remote_mode=req xdebug.var_display_max_children=-1 xdebug.var_display_max_data=-1 xdebug.var_display_max_depth=-1php-fpm的xdebug.ini
xdebug.remote_host=host.docker.internal xdebug.remote_connect_back=0 xdebug.remote_port=9000 xdebug.idekey=PHPSTORM xdebug.remote_autostart=0 xdebug.remote_enable=1 xdebug.cli_color=0 xdebug.profiler_enable=0 xdebug.profiler_output_dir="~/xdebug/phpstorm/tmp/profiling" xdebug.remote_handler=dbgp xdebug.remote_mode=req xdebug.var_display_max_children=-1 xdebug.var_display_max_data=-1 xdebug.var_display_max_depth=-1 -
重新laradock的workspace和php-fpm的镜像
docker-compose build workspace php-fpm
build完之后需要重启laradock。
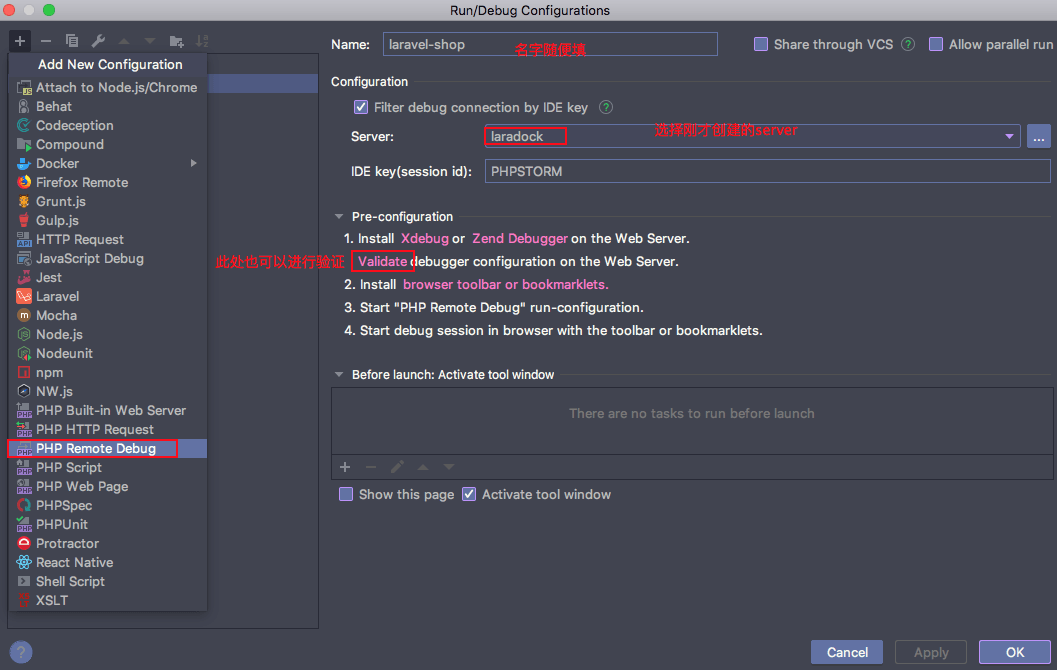
4.配置PHPSTORM
添加server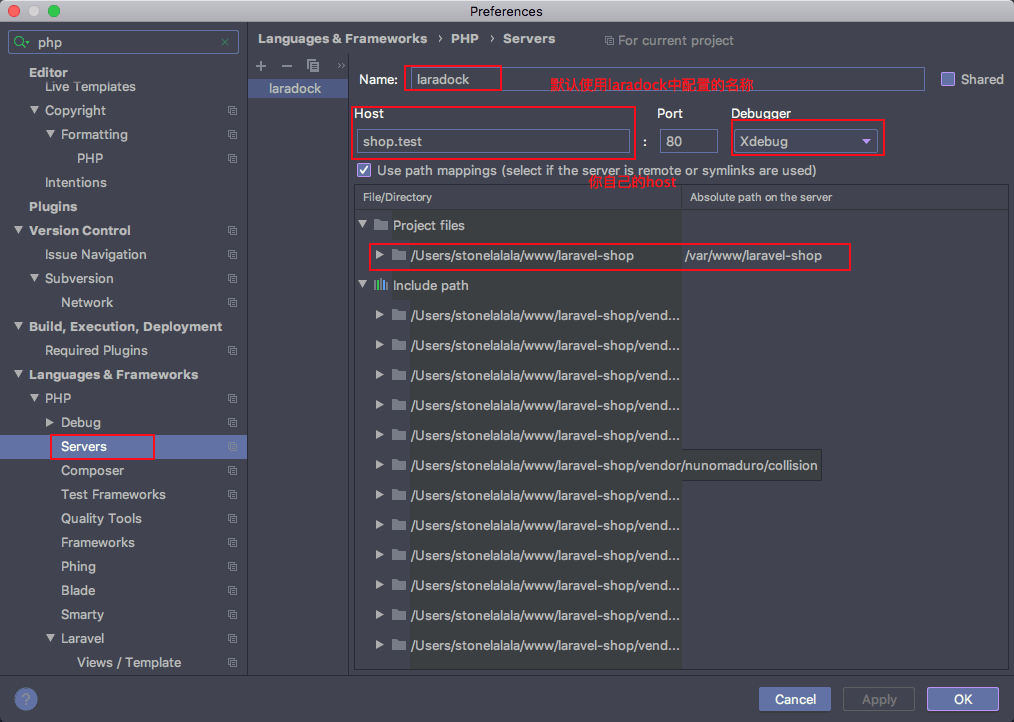
配置DBGp Proxy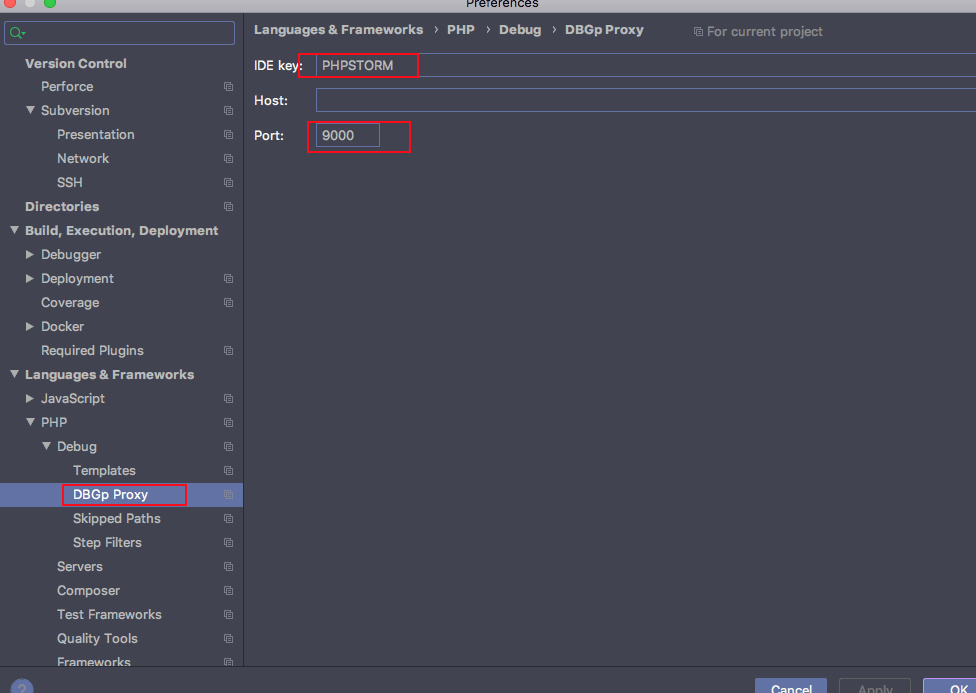
点击debug页签中的validate,配置一下你的项目,然后按窗口右下角的validate,如图为验证通过的界面,如果验证不通过的话,会有相应的提示。这个validata也可以在配置监听那边验证。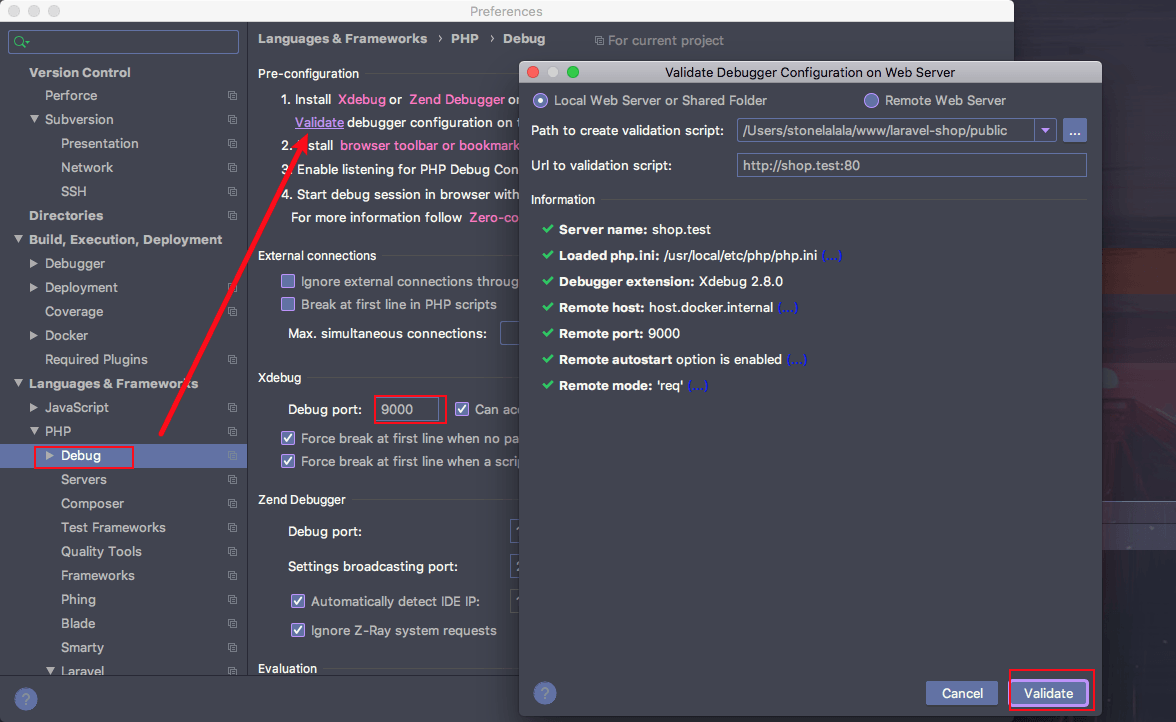
点击phpstorm右上角的的图中的这个选项,进入配置页面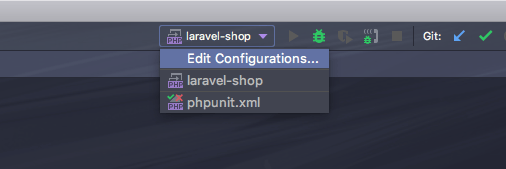
添加完之后点击确定。 -
查看调试效果
用curl方式进行请求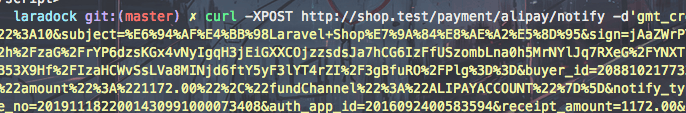
调试界面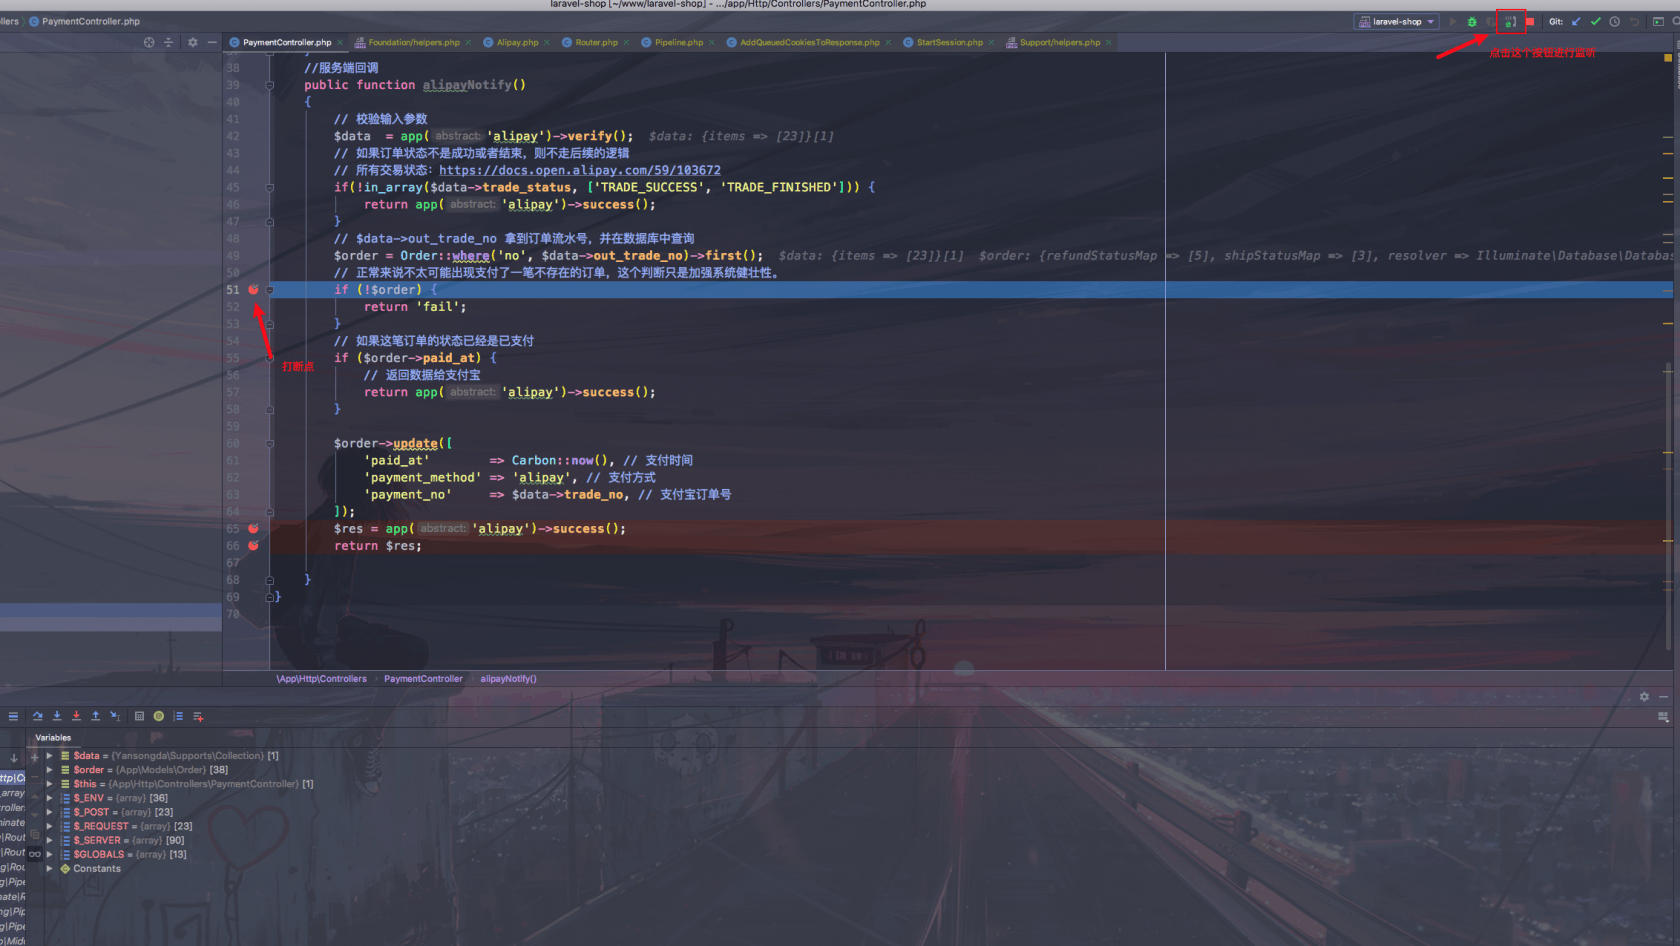
-
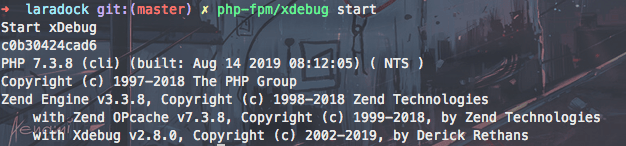
关于开启与关闭xdebug
在laradock的根目录可以进行xdebug的开关
命令分别为:
开启php-fpm/xdebug start
关闭php-fpm/xdebug stop
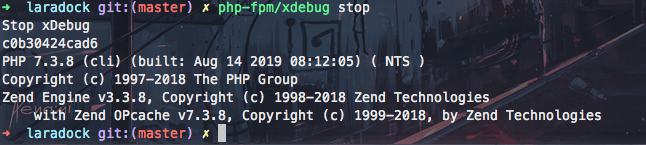
建议需要使用debug的时候才开启,因为开启debug,请求的时间相差很大。
同一界面,开启debug与不开启请求时间的差别。
开启: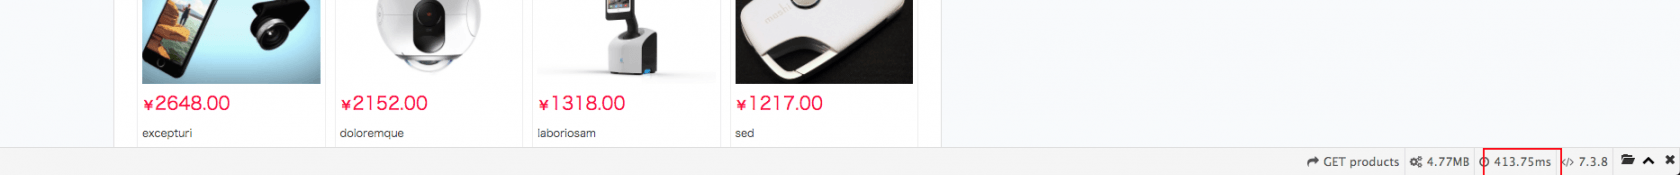
关闭: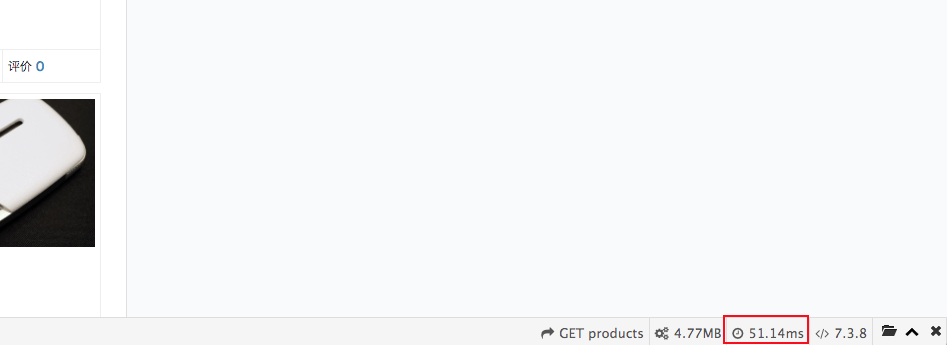
本作品采用《CC 协议》,转载必须注明作者和本文链接


 关于 LearnKu


推荐文章: