
go-zero docker-compose 搭建课件服务(七):prometheus+grafana服务监控
3 / 0 / 创建于 3年前 /
 slowquery 的个人博客
0、转载
go-zero docker-compose 搭建课件服务(七):prometheus+grafana服务监控
0.1源码地址
github.com/liuyuede123/go-zero-cou...
1、什么是prometheus
Prometheus是一个开源的系统监控和警报工具包。自2012年启动以来,许多公司和组织都采用了Prometheus,该项目拥有非常活跃的开发人员和用户社区。它现在是一个独立的开源项目,独立于任何公司进行维护。Prometheus于2016年加入云原生计算基金会,成为继Kubernetes之后的第二个托管项目。
特性:
- 一个多维数据模型,包含由指标名称和键/值对(Tag)标识的时间序列数据
- PromQL是一种灵活的查询语音,用于查询并利用这些维度数据
- 不依赖分布式存储,单个服务器节点是自治的
- 时间序列收集是通过HTTP上的pull模型进行的(支持Pull)
- 推送时间序列是通过一个中间网关来支持的(也支持Push)
- 目标是通过服务发现或静态配置发现的
- 多种模式的图形和仪表盘支持
2、什么是grafana
grafana是用于可视化大型测量数据的开源程序,他提供了强大和优雅的方式去创建、共享、浏览数据。dashboard中显示了你不同metric数据源中的数据。
Grafana是一个开源的,拥有丰富dashboard和图表编辑的指标分析平台,和Kibana不同的是Grafana专注于时序类图表分析,而且支持多种数据源,如Prometheus、Graphite、InfluxDB、Elasticsearch、Mysql、K8s、Zabbix等。
3、prometheus部署
根目录下增加prometheus的Dockerfile
FROM bitnami/prometheus:latest

LABEL maintainer="liuyuede123 <liufutianoppo@163.com>"
增加prometheus配置
# my global config
global:
  scrape_interval: 15s # Set the scrape interval to every 15 seconds. Default is every 1 minute.
  evaluation_interval: 15s # Evaluate rules every 15 seconds. The default is every 1 minute.
  # scrape_timeout is set to the global default (10s).

# Alertmanager configuration
alerting:
  alertmanagers:
    - static_configs:
        - targets:
          # - alertmanager:9093

# Load rules once and periodically evaluate them according to the global 'evaluation_interval'.
rule_files:
# - "first_rules.yml"
# - "second_rules.yml"

# A scrape configuration containing exactly one endpoint to scrape:
# Here it's Prometheus itself.
scrape_configs:
  # The job name is added as a label `job=<job_name>` to any timeseries scraped from this config.
  - job_name: 'file_ds'
    file_sd_configs:
      - files:
          - targets.json
[
{
"targets": ["user-api:9081"],
"labels": {
"job": "user-api",
"app": "user-api",
"env": "test",
"instance": "user-api:8300"
}
},
{
"targets": ["user-rpc:9091"],
"labels": {
"job": "user-rpc",
"app": "user-rpc",
"env": "test",
"instance": "user-api:9300"
}
},
{
"targets": ["courseware-api:9082"],
"labels": {
"job": "courseware-api",
"app": "courseware-api",
"env": "test",
"instance": "courseware-api:8400"
}
},
{
"targets": ["courseware-rpc:9092"],
"labels": {
"job": "courseware-rpc",
"app": "courseware-rpc",
"env": "test",
"instance": "courseware-rpc:9400"
}
}
]文件结构如下
prometheus
├── Dockerfile
├── prometheus.yml
└── target.json
docker-compose中增加prometheus配置,默认9090端口
...

prometheus:
  build:
    context: ./prometheus
  environment:
    - TZ=Asia/Shanghai
  privileged: true
  volumes:
    - ./prometheus/prometheus.yml:/opt/bitnami/prometheus/conf/prometheus.yml  # 将 prometheus 配置文件挂载到容器里
    - ./prometheus/target.json:/opt/bitnami/prometheus/conf/targets.json  # 将 prometheus 配置文件挂载到容器里
  ports:
    - "9090:9090"                     # 设置容器9090端口映射指定宿主机端口,用于宿主机访问可视化web
  networks:
    - backend
  restart: always
user-api配置中增加
...
Prometheus:
  Host: 0.0.0.0
  Port: 9081
  Path: /metrics
user-rpc配置中增加
...
Prometheus:
  Host: 0.0.0.0
  Port: 9091
  Path: /metrics
courseware-api配置中增加
...
Prometheus:
  Host: 0.0.0.0
  Port: 9082
  Path: /metrics
courseware-rpc配置中增加
Prometheus:
  Host: 0.0.0.0
  Port: 9092
Path: /metrics删除容器和镜像重新生成构建容器docker-compose up -d --build
浏览器中访问http://localhost:9090/到prometheus后台查看是否生效
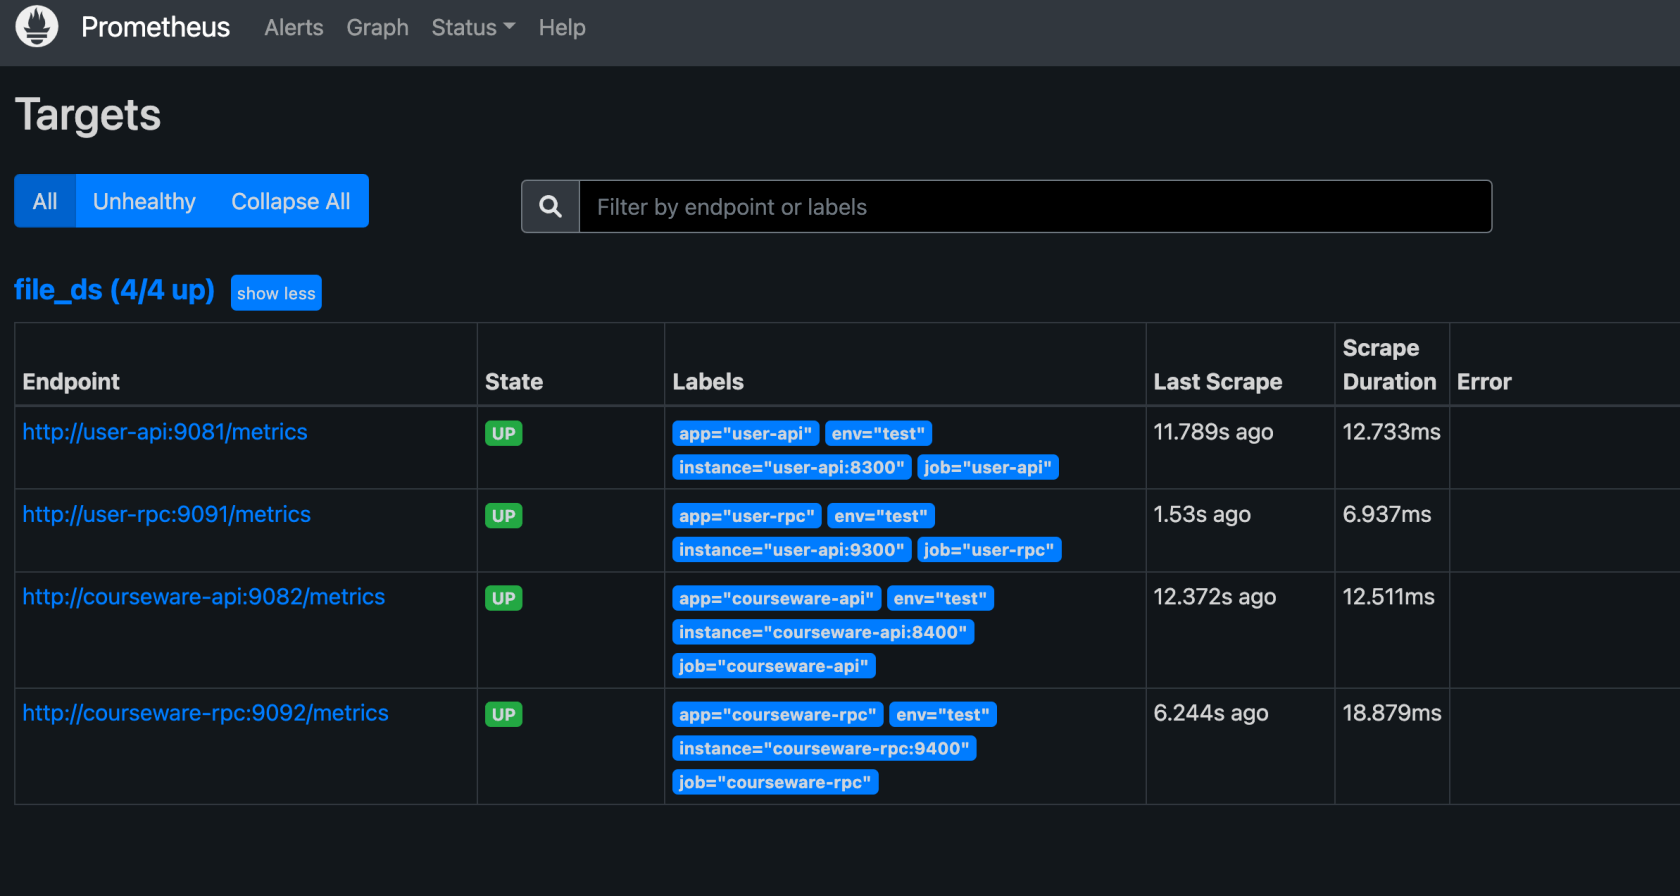
访问http://localhost:9090/targets?search=可以看到,4个服务的metrics都进来了
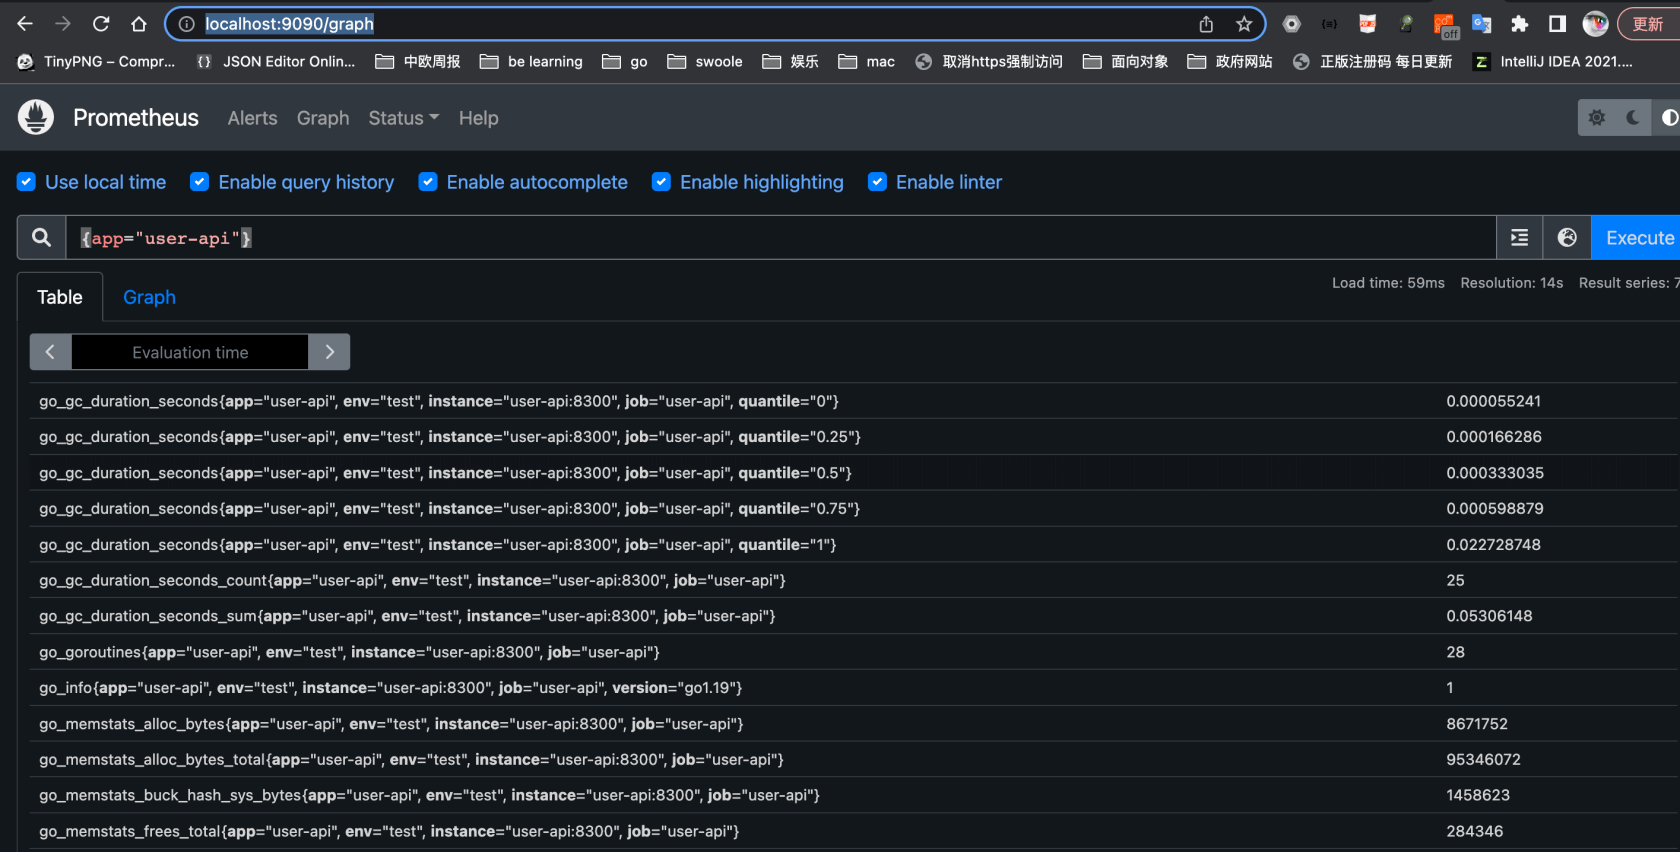
请求用户详情接口,然后访问下http://localhost:9090/graph,搜索栏中输入`{app="user-api"}`,会看到
4、部署grafana
新建grafana文件夹,并创建Dockerfile
FROM grafana/grafana:latest

LABEL maintainer="liuyuede123 <liufutianoppo@163.com>"
docker-compose中新增grafana服务
 ...

  grafana:
    build:
      context: ./grafana
    environment:
      - TZ=Asia/Shanghai
    privileged: true
    ports:
      - "3000:3000"
    networks:
      - backend
restart: always删除容器和镜像重新生成构建容器docker-compose up -d --build
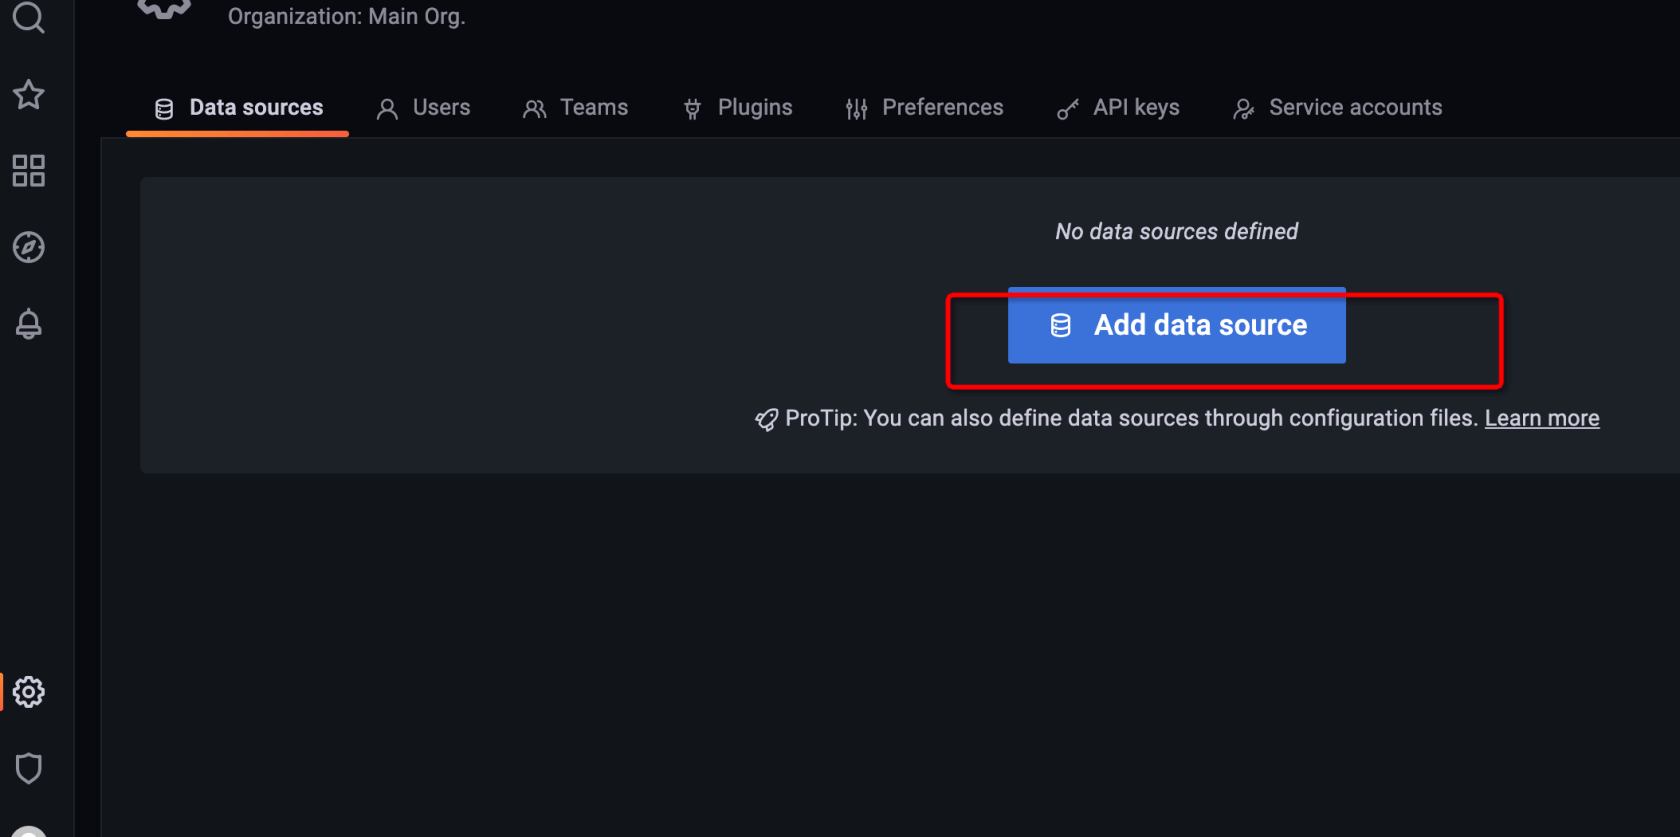
访问http://localhost:3000/,默认账号admin,密码admin
点击设置新增数据源
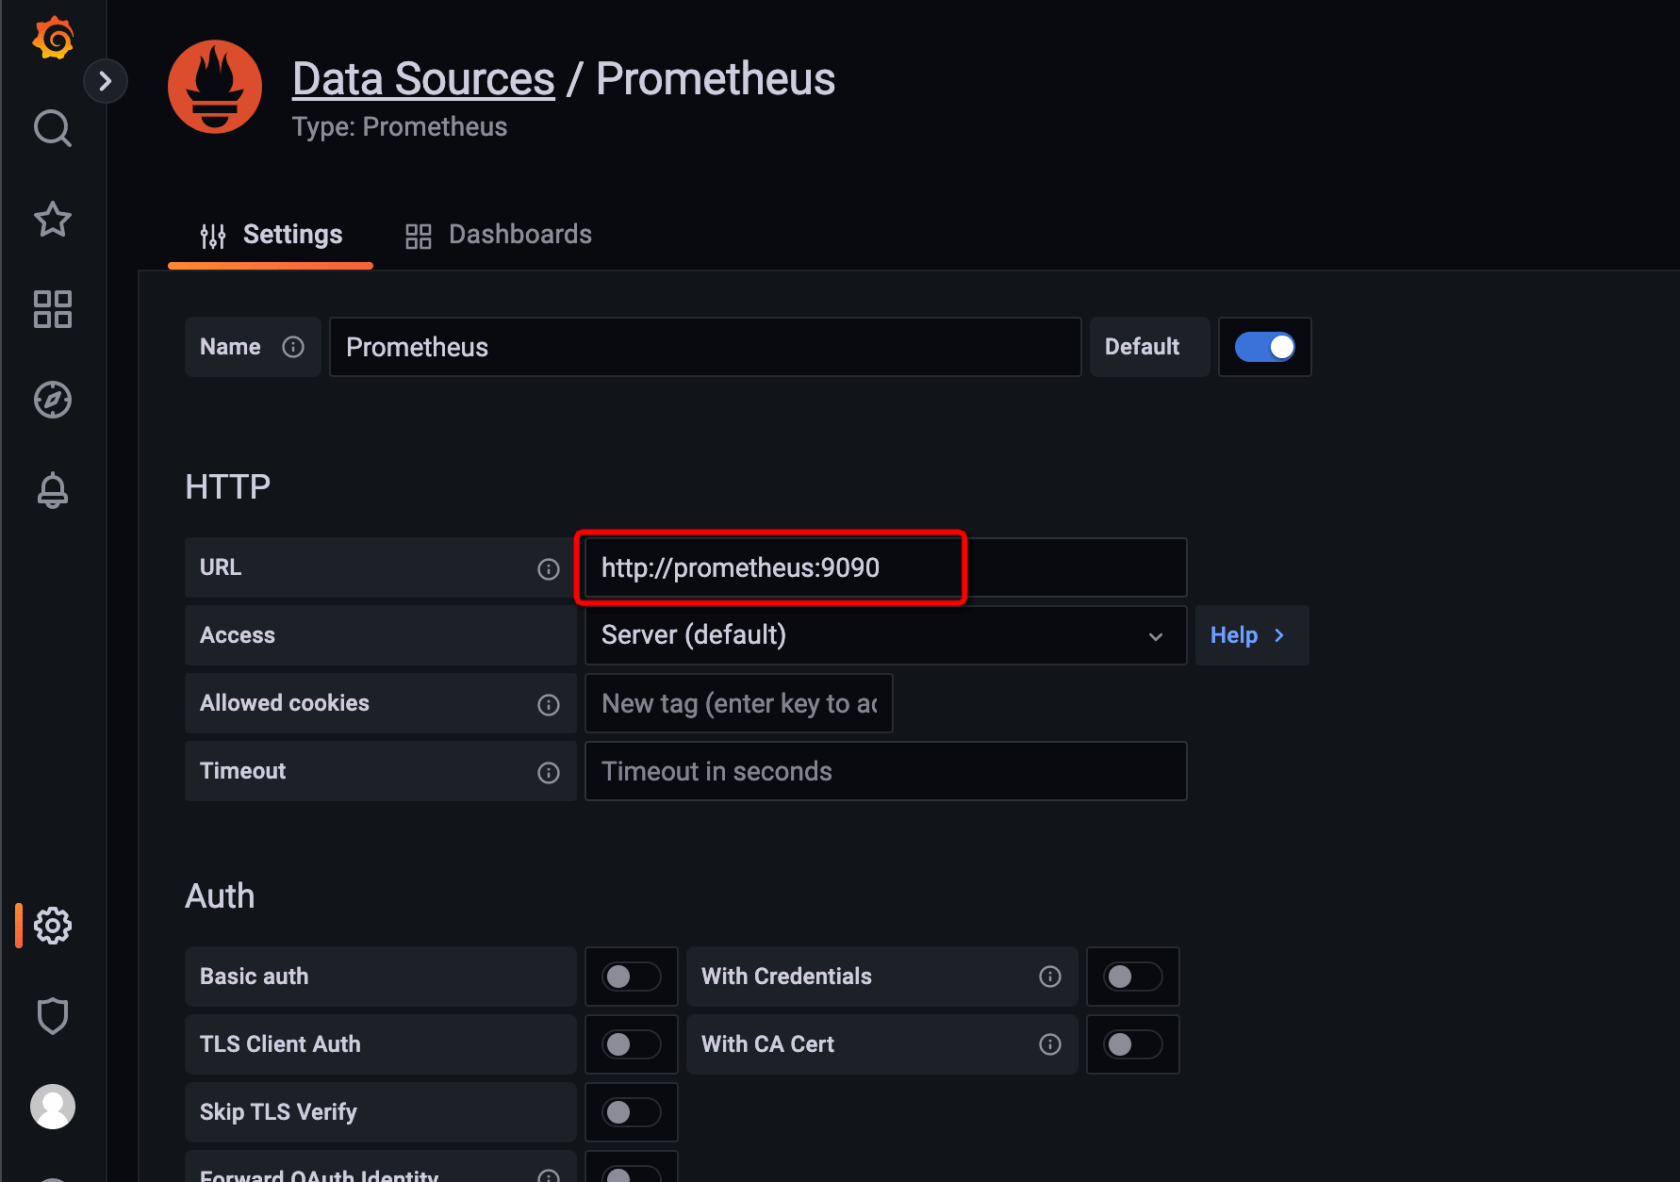
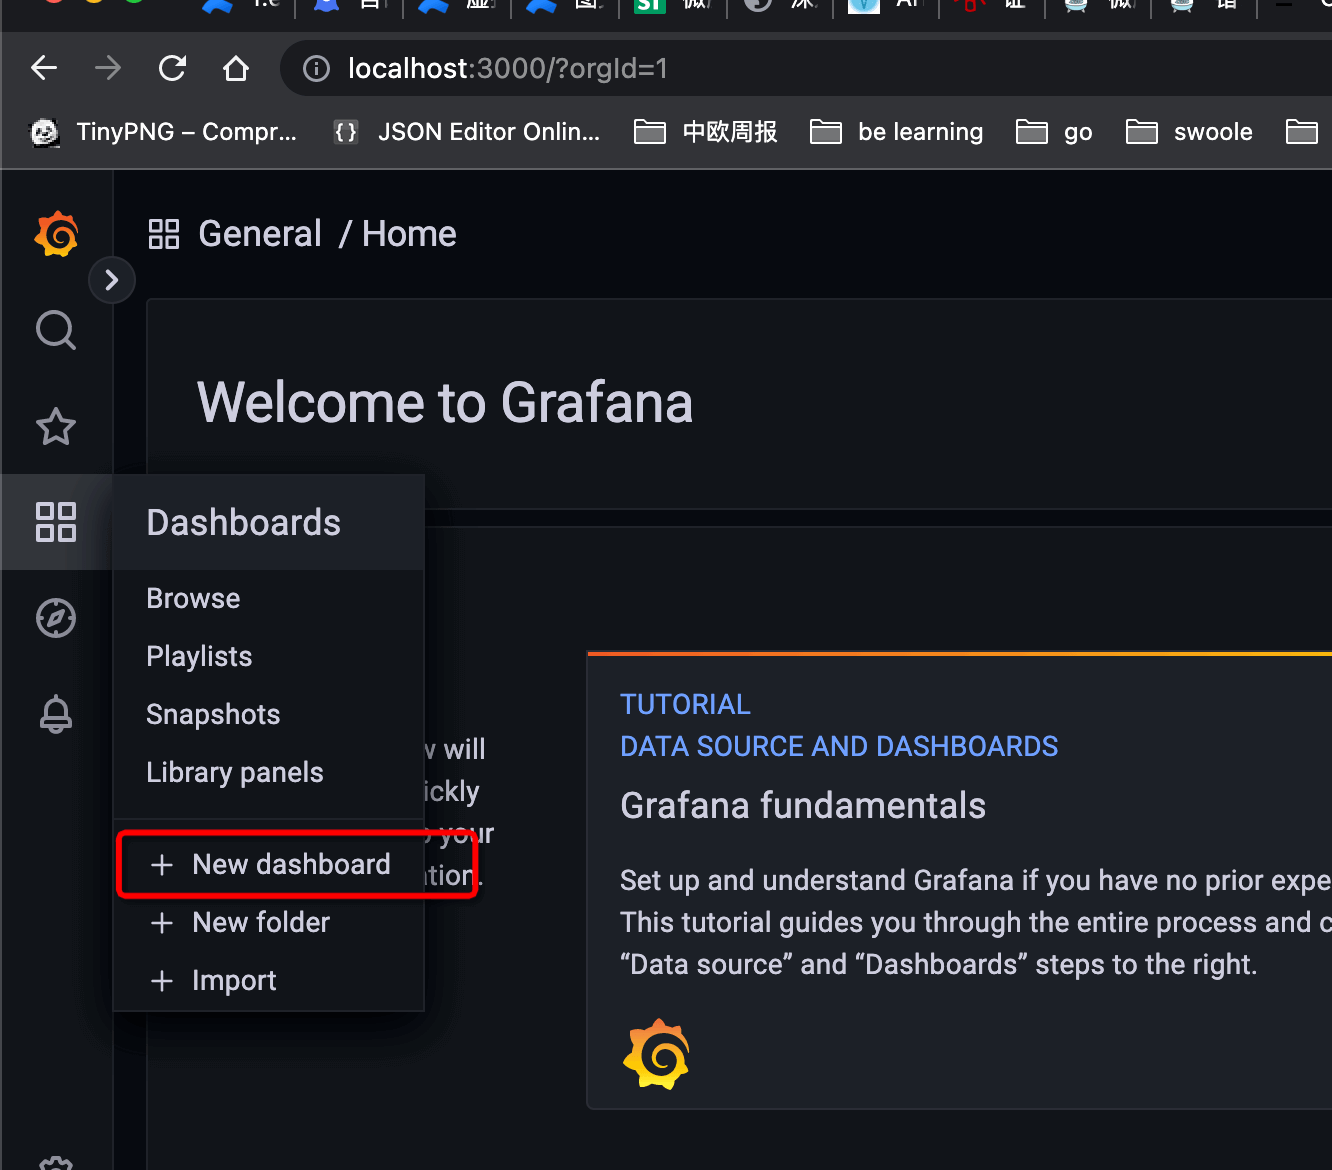
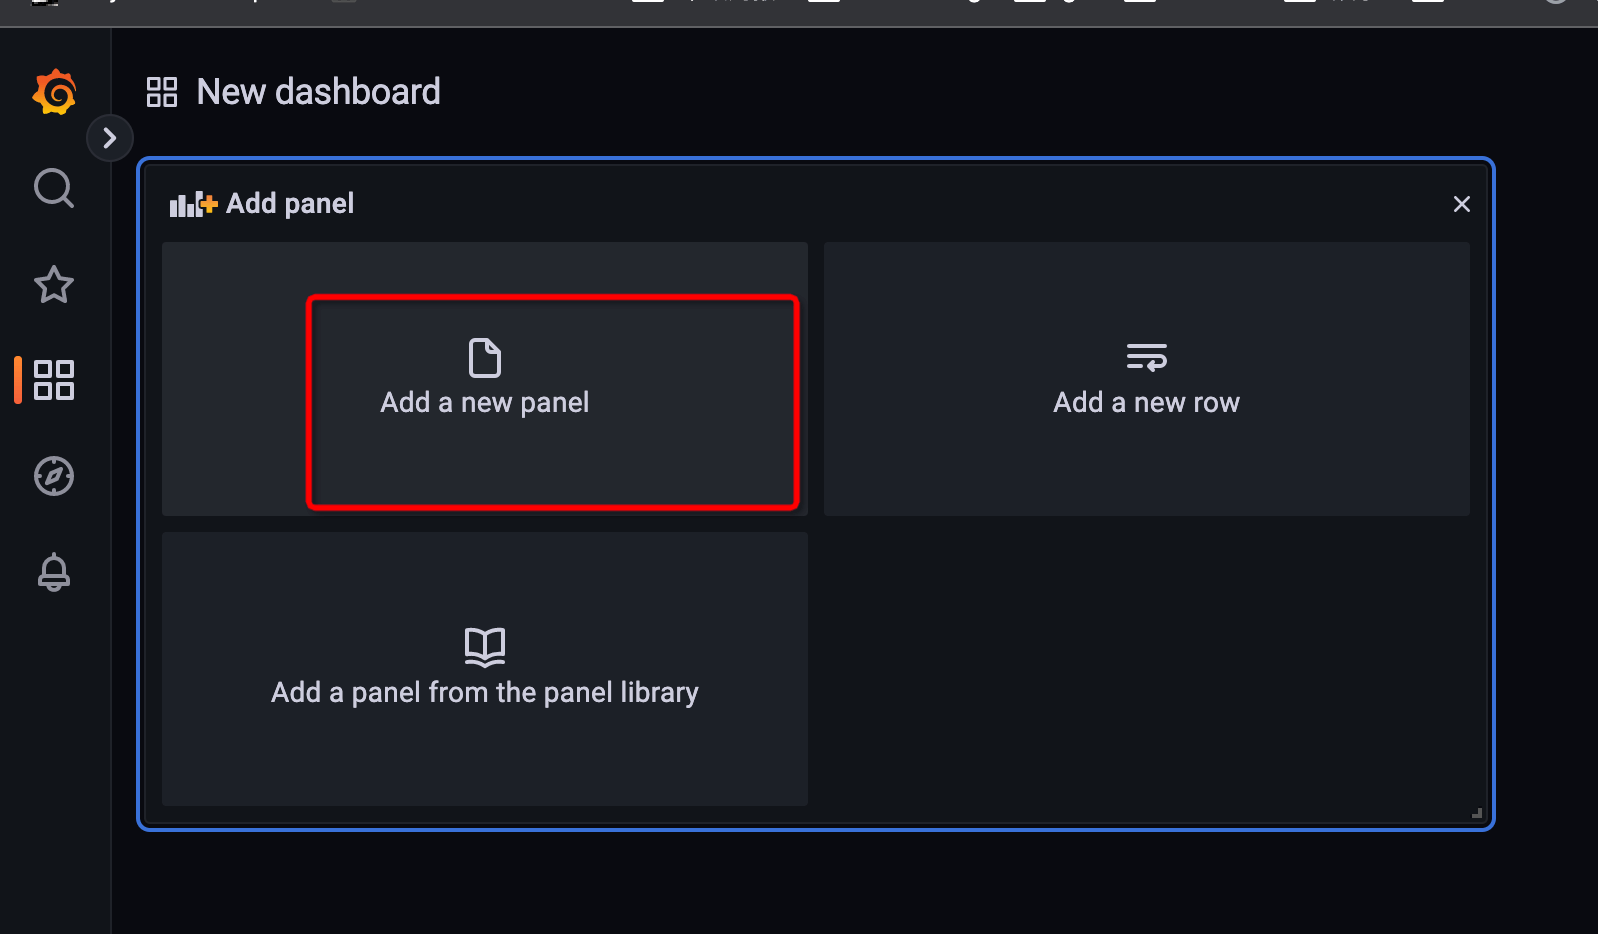
新增看板
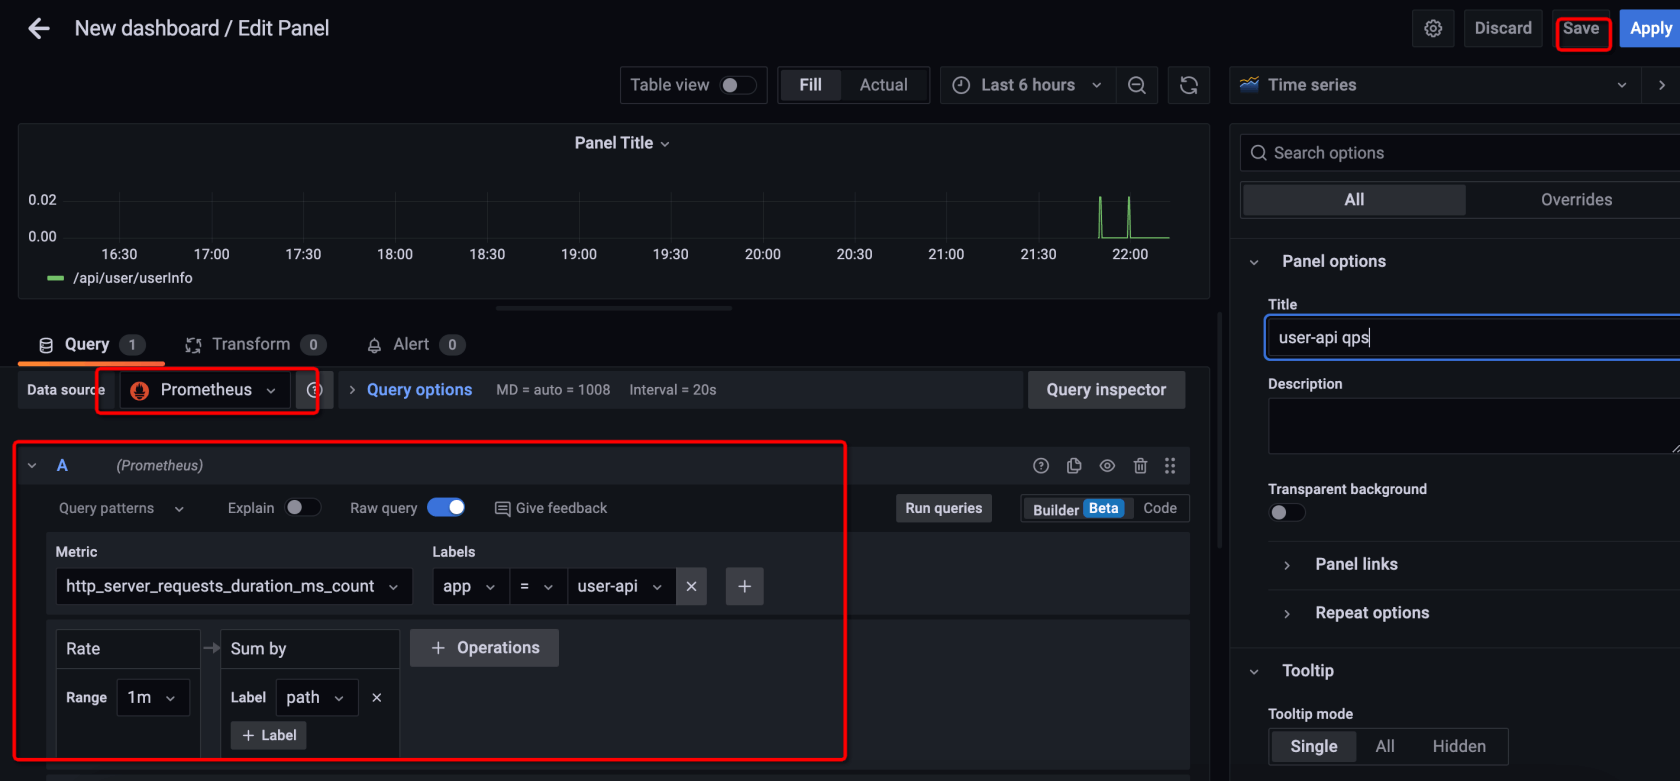
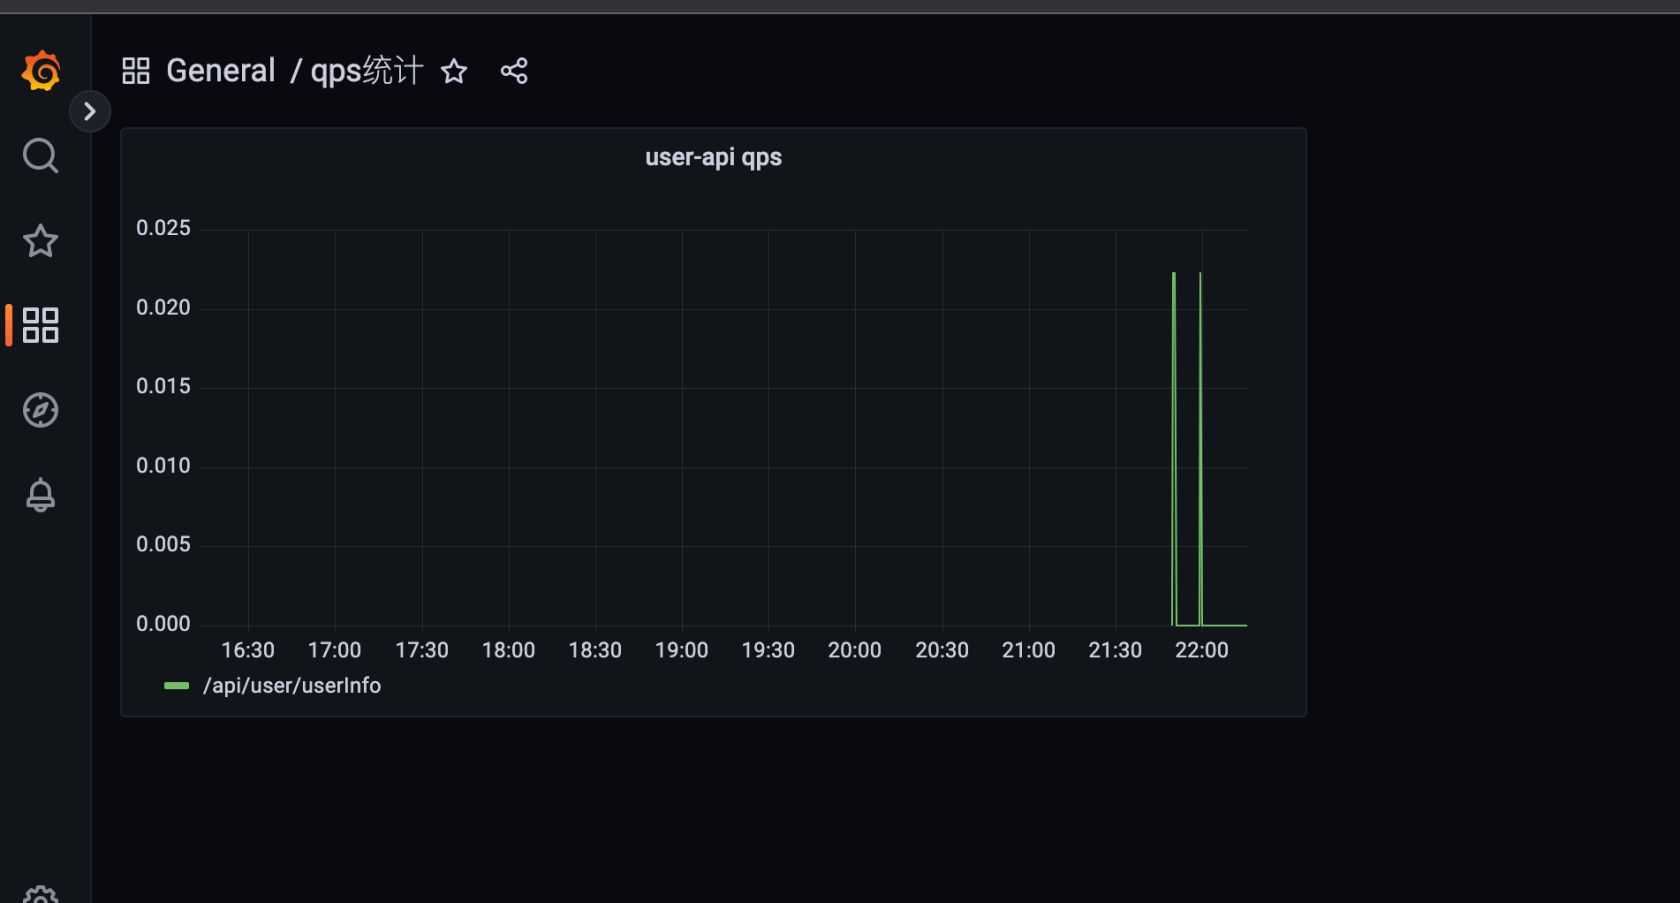
数据源选择prometheus统计user-api qps然后点击保存
本作品采用《CC 协议》,转载必须注明作者和本文链接


 关于 LearnKu


推荐文章: