
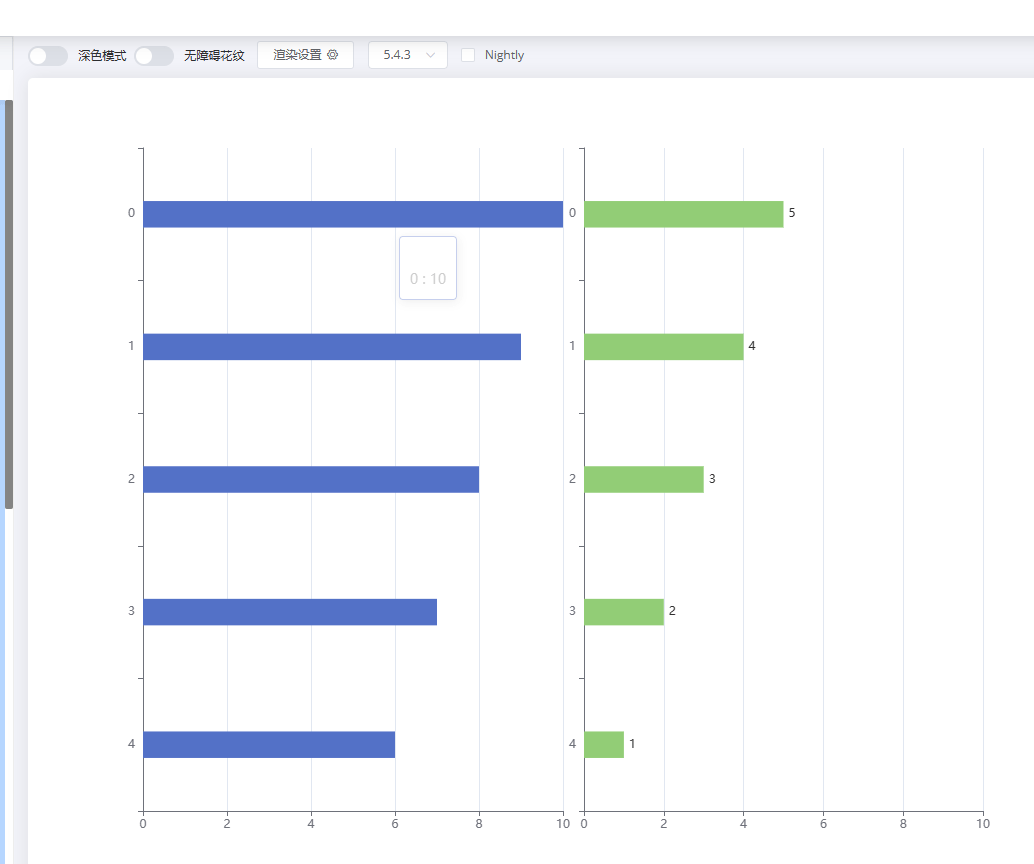
echarts 多grid 显示条状图,前后数值比例一致的用法。
import * as echarts from 'echarts';

var chartDom = document.getElementById('main');
var myChart = echarts.init(chartDom);
var option;

let data = [10, 9, 8, 7, 6, 5, 4, 3, 2, 1];

option = {
  tooltip: {
    trigger: 'item',
    formatter: '{a} <br/>{b} : {c} '
  },
  title: {
    text: '求职需求前10',
    x: 20,
    y: 13,
    textStyle: {
      color: '#fff',
      fontSize: 19,
      fontWeight: 700
    }
  },
  grid: [
    {
      // top: '50%',
      right: '50%'
    },
    {
      // top: '50%',
      left: '52%'
    }
  ],
  xAxis: [
    {
      type: 'value',
      scale: false,
      axisTick: { show: true },
      axisLabel: { show: true },
      axisLine: { show: true },
      gridIndex: 0
    },
    {
      type: 'value',
      scale: false,
      max: data[0],
      axisTick: { show: true },
      axisLabel: { show: true },
      axisLine: { show: true },
      gridIndex: 1
    }
  ],
  yAxis: [
    {
      type: 'category',
      gridIndex: 0,
      inverse: true,
      value: [1, 2, 3, 4, 5]
    },
    {
      type: 'category',
      axisTick: { show: true },
      axisLabel: { show: true },
      axisLine: { show: true },
      gridIndex: 1,
      inverse: true,
      value: [6, 7, 8, 9, 10]
    }
  ],
  series: [
    {
      name: '',
      type: 'bar',
      xAxisIndex: 0,
      yAxisIndex: 0,
      barWidth: '20%',
      data: data.slice(0, 5)
    },
    {
      name: '',
      type: 'bar',
      scale: true,
      xAxisIndex: 1,
      yAxisIndex: 1,
      barWidth: '20%',
      data: data.slice(5, 10),
      label: {
        show: true,
        position: 'right'
      }
    }
  ]
};

option && myChart.setOption(option);
受到 这个的启发。


 关于 LearnKu


推荐文章: