
How to configure a Vagrant (Homestead) VM in Phpstorm with Xdebug on Mac
0 / 0 / 创建于 7年前 /
 hustnzj 的个人博客
How to configure a Vagrant(homestead) VM in Phpstorm with Xdebug on Mac
- I used to debug only with var_dump or echo which was very stupid and exhausted. Laravel's default debug output mitigate the pain greatly, but if u understand how to debug in IDE, everything will be much easier!
- The software versions as below:
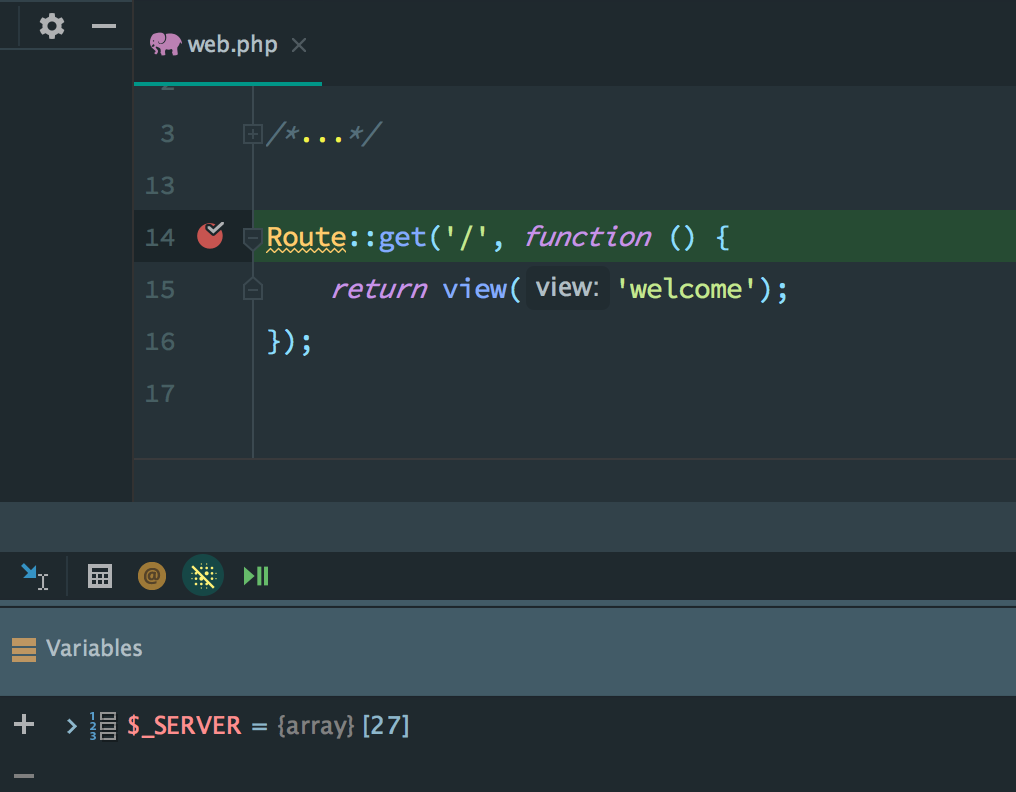
The debug result of the same script are different by two debug ways
Start a debug session from web browser
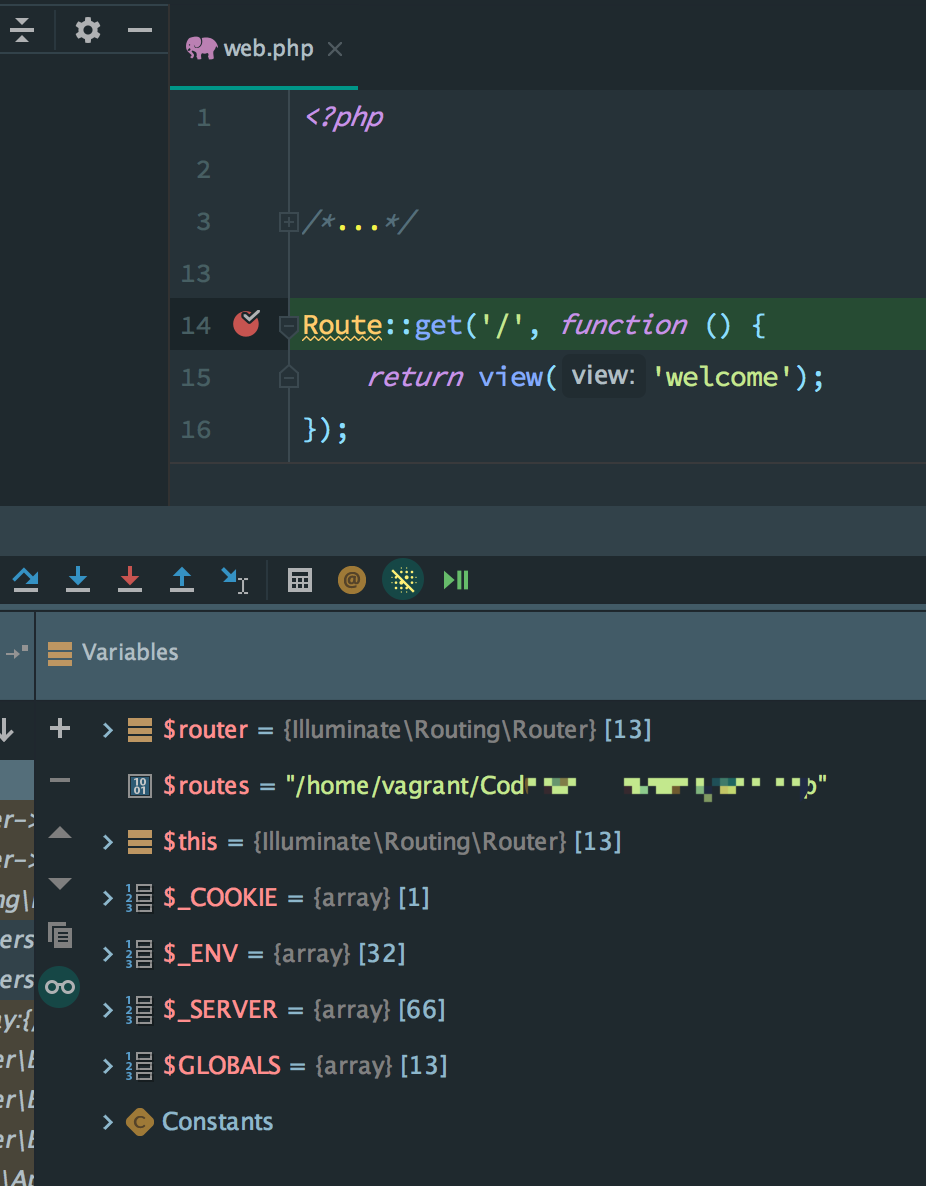
Start a debug session from phpstorm
How to configure
The web browser way (Starting from browser)
-
This way is the most common and very useful for usual development
-
Install Xdebug. It's default installed in homestead.
-
Create a sever. That's very important!
- Open the Preferences, go to the Languages & Frameworks > PHP > Servers, adding a server. Input the Name of server, the Host name and port of the URL u will debug, check Use path mappings, and type the
rootpath of Project files on local and remote.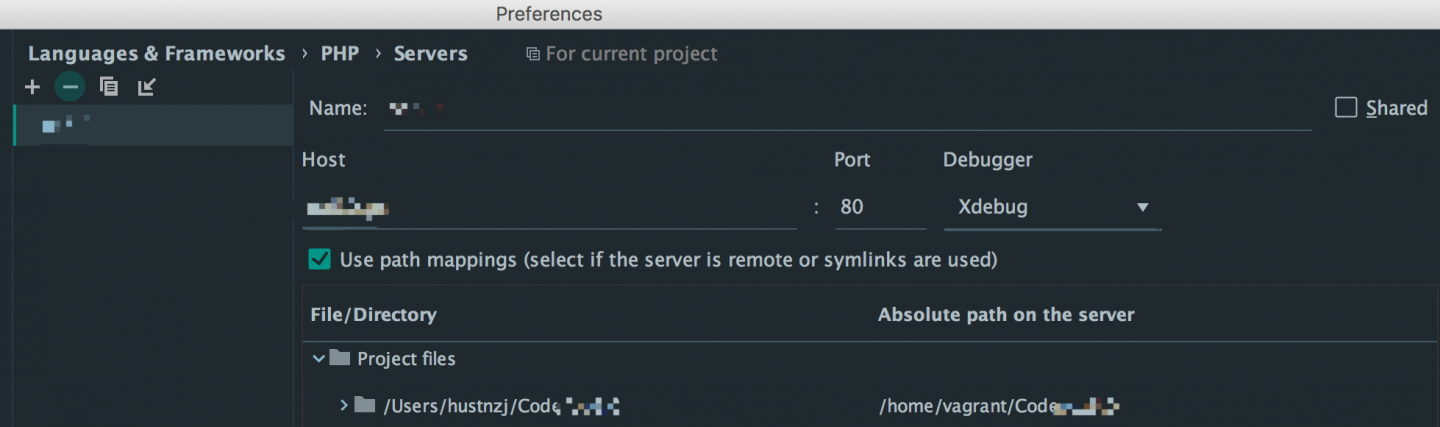
- Open the Preferences, go to the Languages & Frameworks > PHP > Servers, adding a server. Input the Name of server, the Host name and port of the URL u will debug, check Use path mappings, and type the
-
Edit the xdebug configuration file.
- On the vagrant VM side, make sure the
xdebug.inicontents as below. The homestead contains four php versions, make sure u edit the right one.zend_extension=xdebug.so xdebug.remote_enable = 1 xdebug.remote_connect_back =1 xdebug.remote_port = 9000
- On the vagrant VM side, make sure the
-
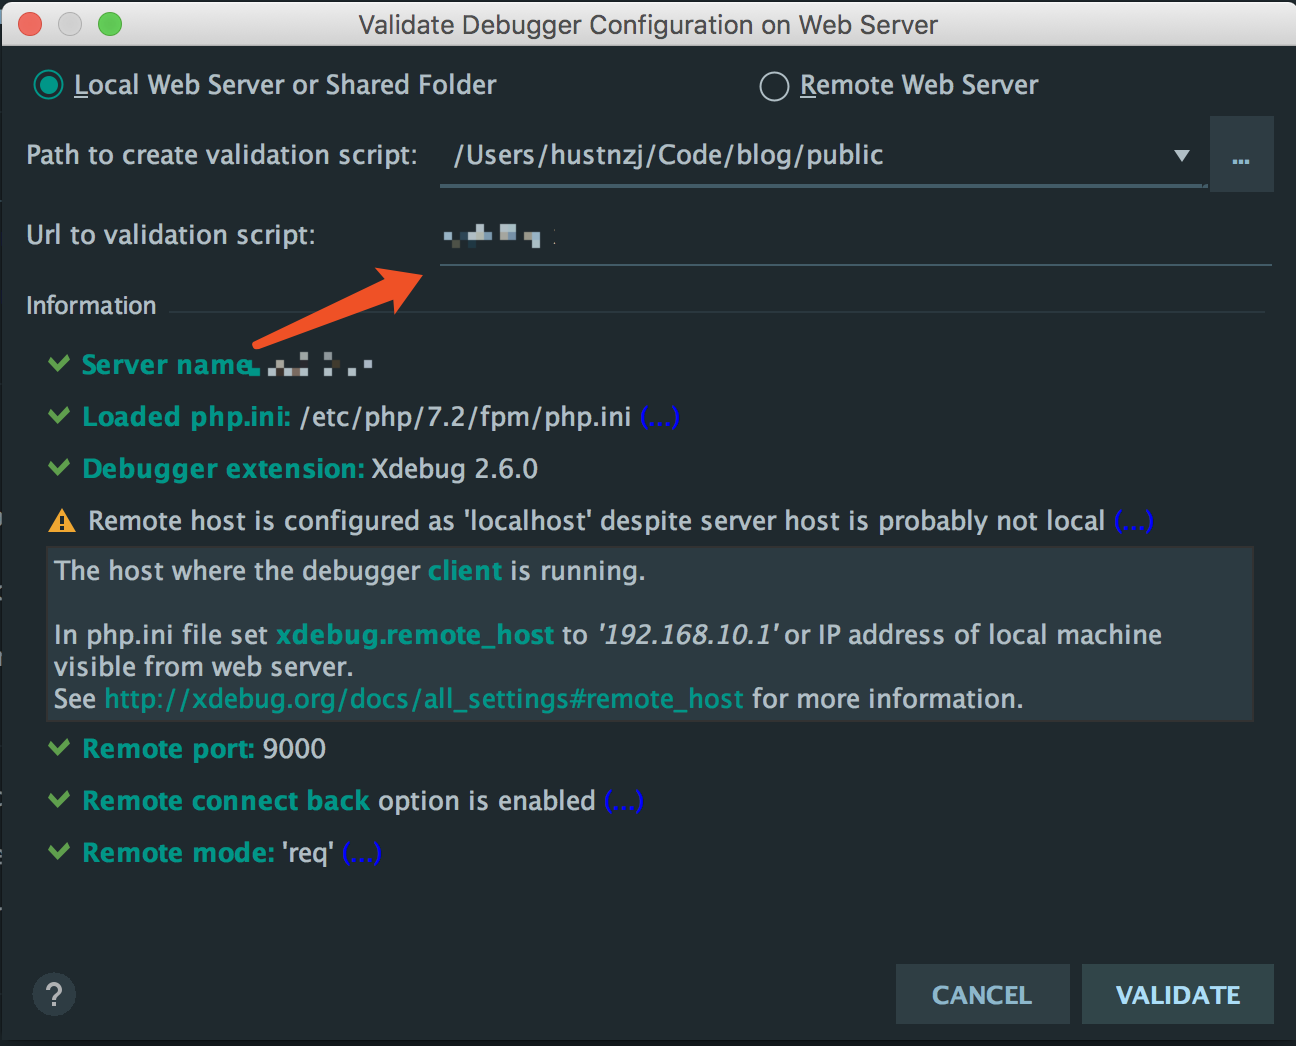
Validate debugger configuration on the web server. ( Validate result will tell you how to do. U can see Remote host is configured as ..., don't mind it, as we configure remote_connect_back=1 in the xdebug.ini)
-
Install browser toolbar.
-
Enable listening for PHP Debug Connections.
- All the three steps are too easy to be mentioned.
-
Type the correct Debug port in the Xdebug section of Languages & Frameworks > PHP > Debug, which is the same value with the one in xdebug.ini.
The cli way (Starting from PhpStorm)
-
This way is very useful for debugging single php script file such as artisan.
-
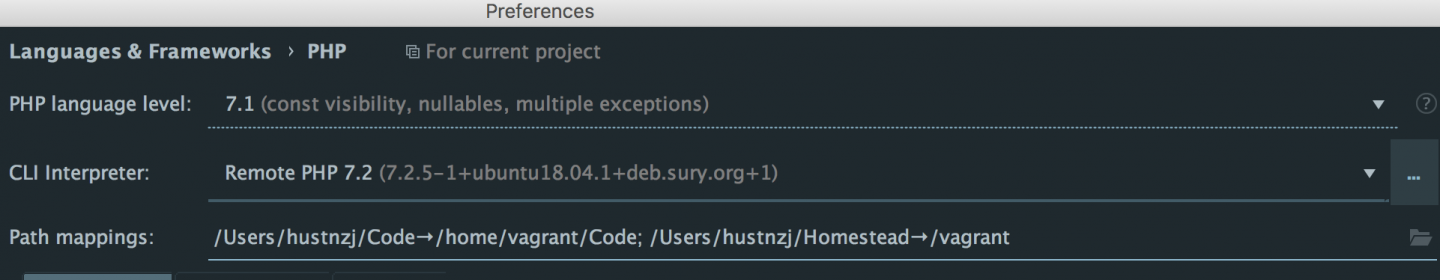
Add the CLI Interpreter. Using the Vagrant way.
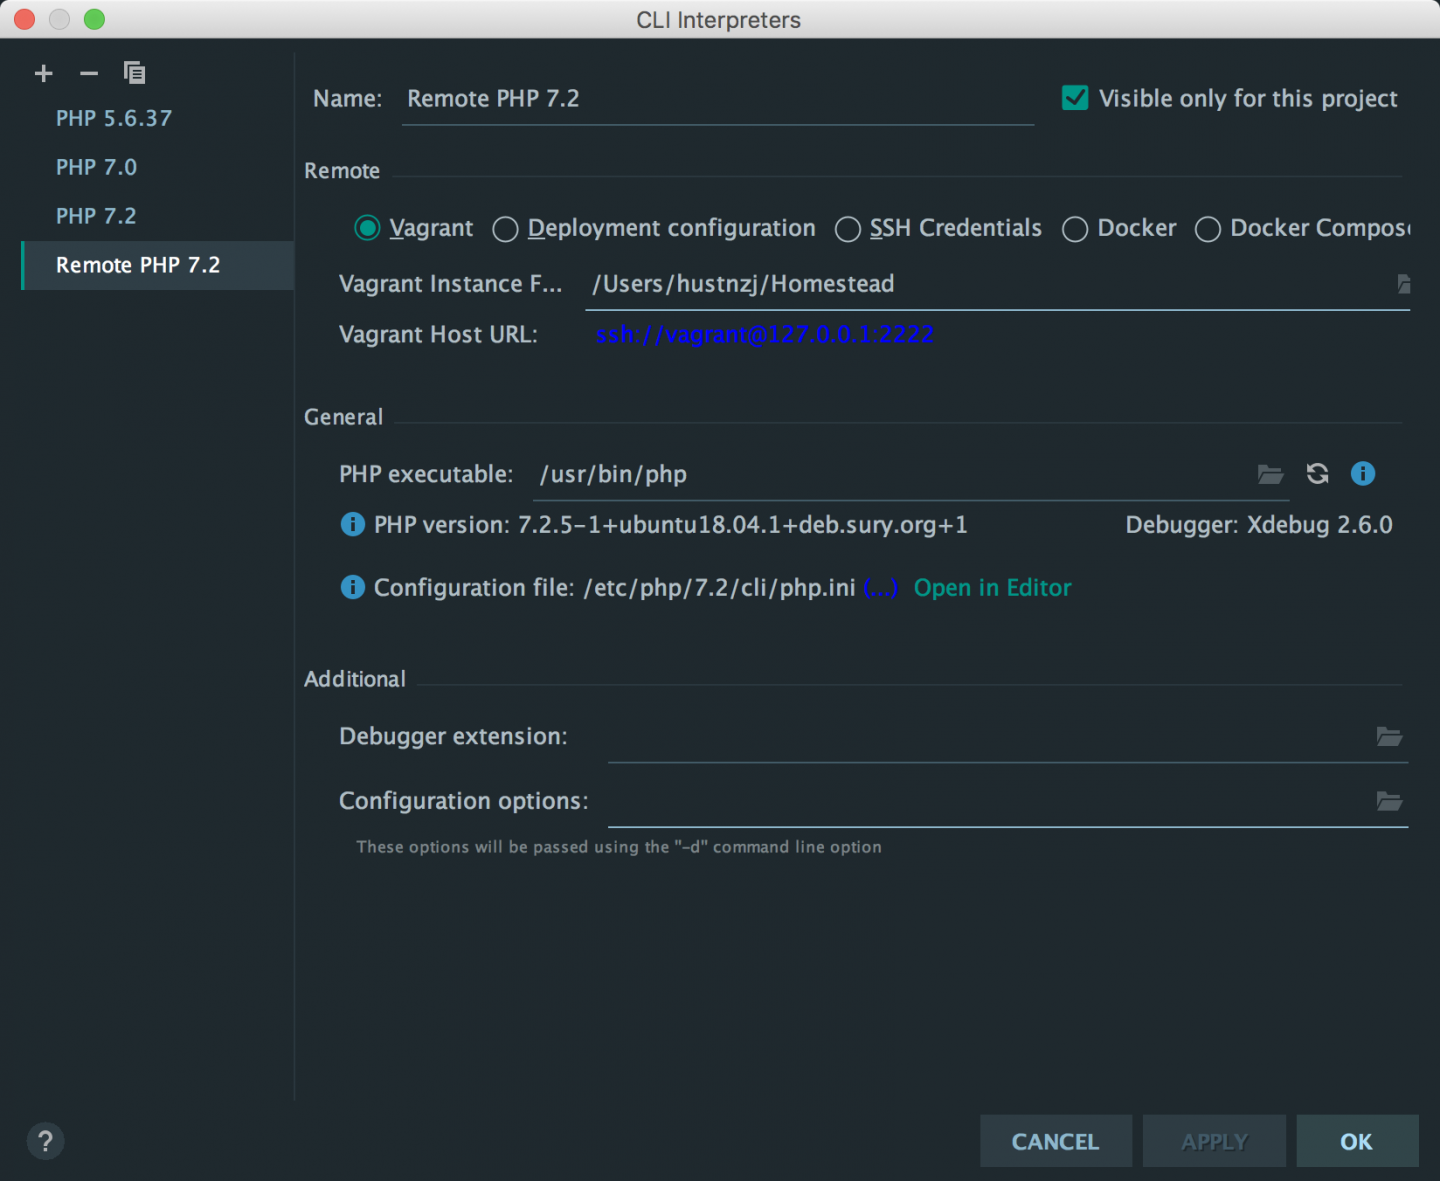
- The Path mappings will be filled automatically.
- If u can't find the cli xdebug (That's the default), u could copy the same file from the fpm folder to the cli folder. Don't use the command
sudo phpenmod -s cli xdebug, because this command will create a symbolic link to the real xdebug.ini file which will lead to the same debug port on cli and web browser debuging. But it seems that two ways cannot work on the same debug port! That's Key!. So u need to edit a bit of the new copied file, just change the xdebug.port to 9001 or others except 9000 ( 9000 seems to be used by web browser debugging by default and unchangeable) as below:zend_extension=xdebug.so xdebug.remote_enable = 1 xdebug.remote_connect_back =1 xdebug.remote_port = 9001
How to debug
Now, if u want to debug by browser, just keep the default 9000 xdebug port in PhpStorm . If u want to debug by cli, u can just change it to 9001 or other No you set in the xdebug.ini file in the cli folder.
Have a good trip in PHP development! :smile:
References:
- 博客:成为高级 PHP 程序员的第一步——调试(xdebug 配置篇)
- https://xdebug.org/docs/all_settings
- https://www.jetbrains.com/help/phpstorm/de...
- https://confluence.jetbrains.com/display/P...
- https://confluence.jetbrains.com/display/P...
- https://stackoverflow.com/questions/516195...
Remarks:
- If u have installed the
barryvdh/laravel-debugbar, the debug will break at the first line in thepublic/index.phpwhich is not convenient. My solution is to uncheck theBreak at first line in PHP scriptsas below: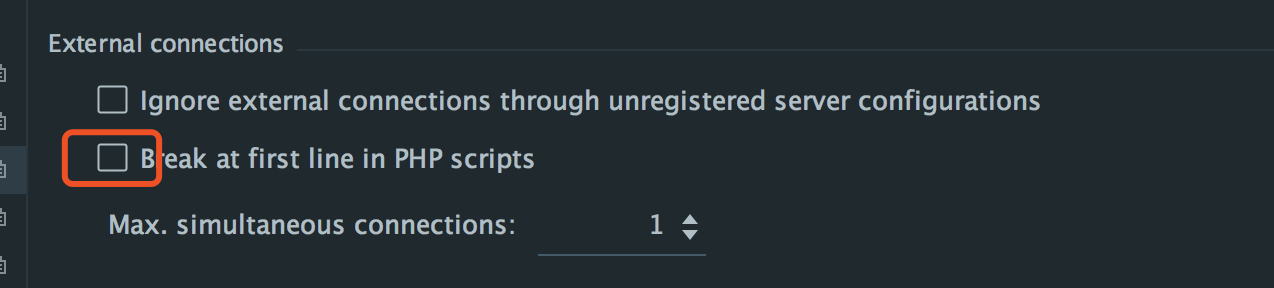
本作品采用《CC 协议》,转载必须注明作者和本文链接


 关于 LearnKu


推荐文章: