
PhpStorm Xdebug 配置与使用
47 / 2 / 创建于 7年前 /
 pingfan 的个人博客
一、安装 Xdebug 扩展
pecl install xdebug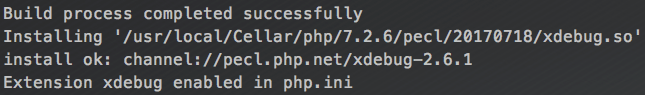
二、Xdebug 配置
查看配置文件
php --ini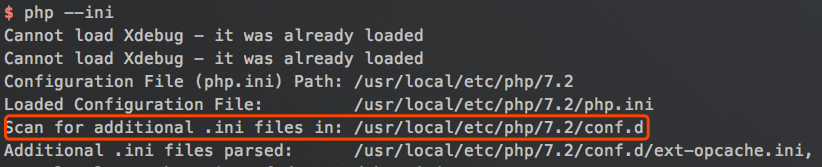
我们在 /usr/local/etc/php/7.2/conf.d 目录下新建一个 ext-xdebug.ini 配置文件,然后添加下列配置
[xdebug]
zend_extension="xdebug.so"
xdebug.profiler_enable=On
xdebug.profiler_enable_trigger=Off
xdebug.profiler_output_dir="/var/tmp/"
xdebug.trace_output_dir="/var/tmp/"
xdebug.profiler_output_name="xdebug.cache.%t-%s"
xdebug.profiler_append=Off
xdebug.remote_enable=On
xdebug.remote_host="localhost"
xdebug.remote_port=9001
xdebug.remote_handler="dbgp"
xdebug.idekey=PHPSTROM
0 或者 Off 代表关闭,1 或者 On 代表开启
xdebug.profiler_enable_trigger: 有关触发器的设置,关闭即可
xdebug.profiler_output_dir:Xdebug 日志记录的地址
xdebug.trace_output_dir:同 xdebug.profiler_output_dir,配置请填写一致
xdebug.profiler_output_name: 日志输出格式
xdebug.profiler_append: 关于附加设置,具体未知
xdebug.remote_enable: 远程调试功能,只要是与浏览器联调,请开启此功能
xdebug.remote_host: 联调的URL主机地址
xdebug.remote_port: 联调的请求端口
xdebug.remote_handler:调试函数,默认 dbgp,不要对其修改
xdebug.idekey:与 PhpStrom 连接时的确认口令,默认 PHPSTROM
重启php服务
valet restart检查下xdebug配置是否生效
php -i | grep xdebug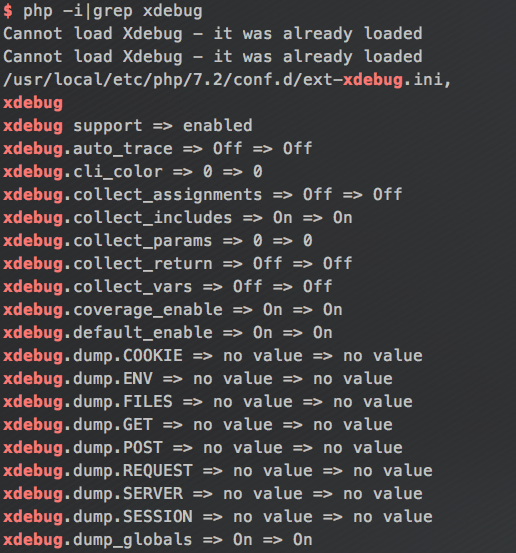
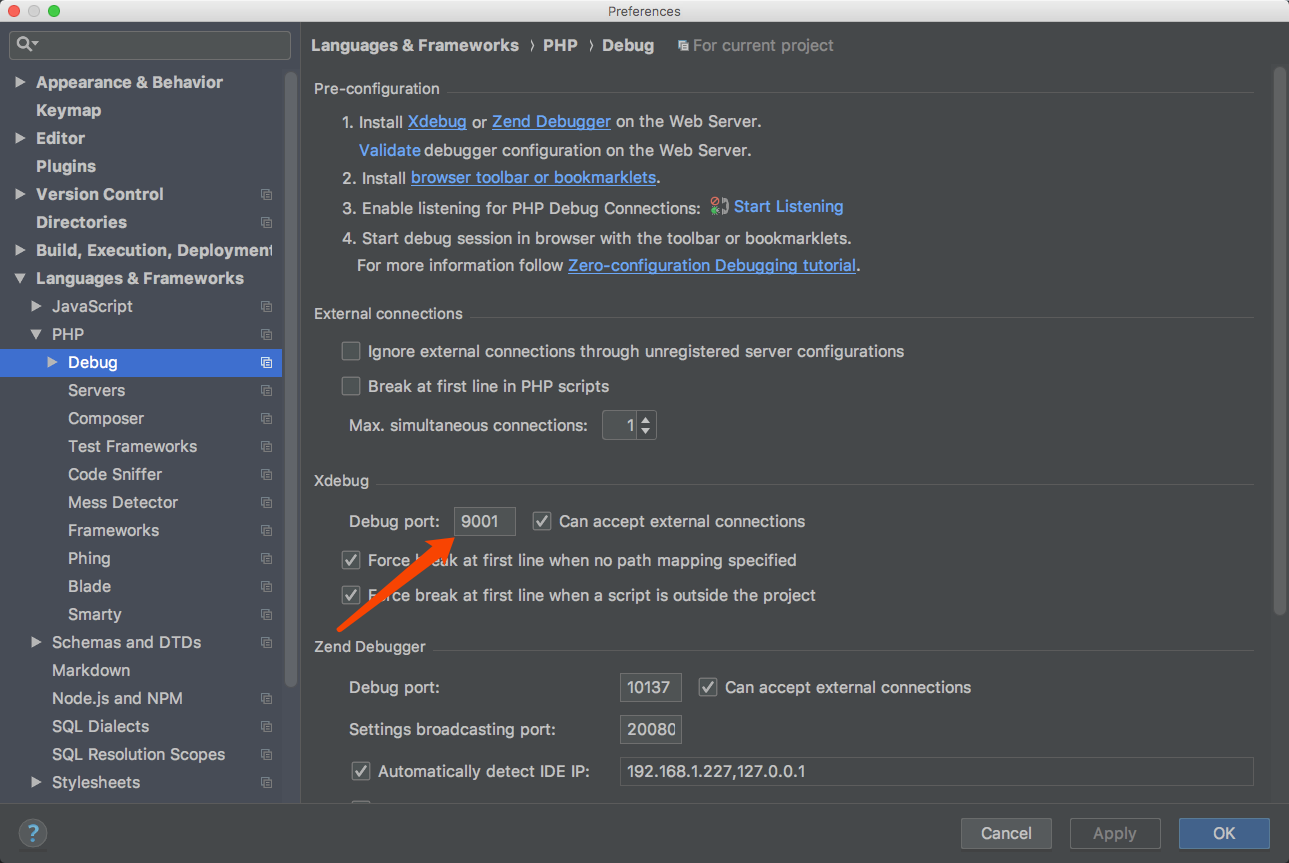
三、PhpStorm配置
1、设置 Xdebug 端口
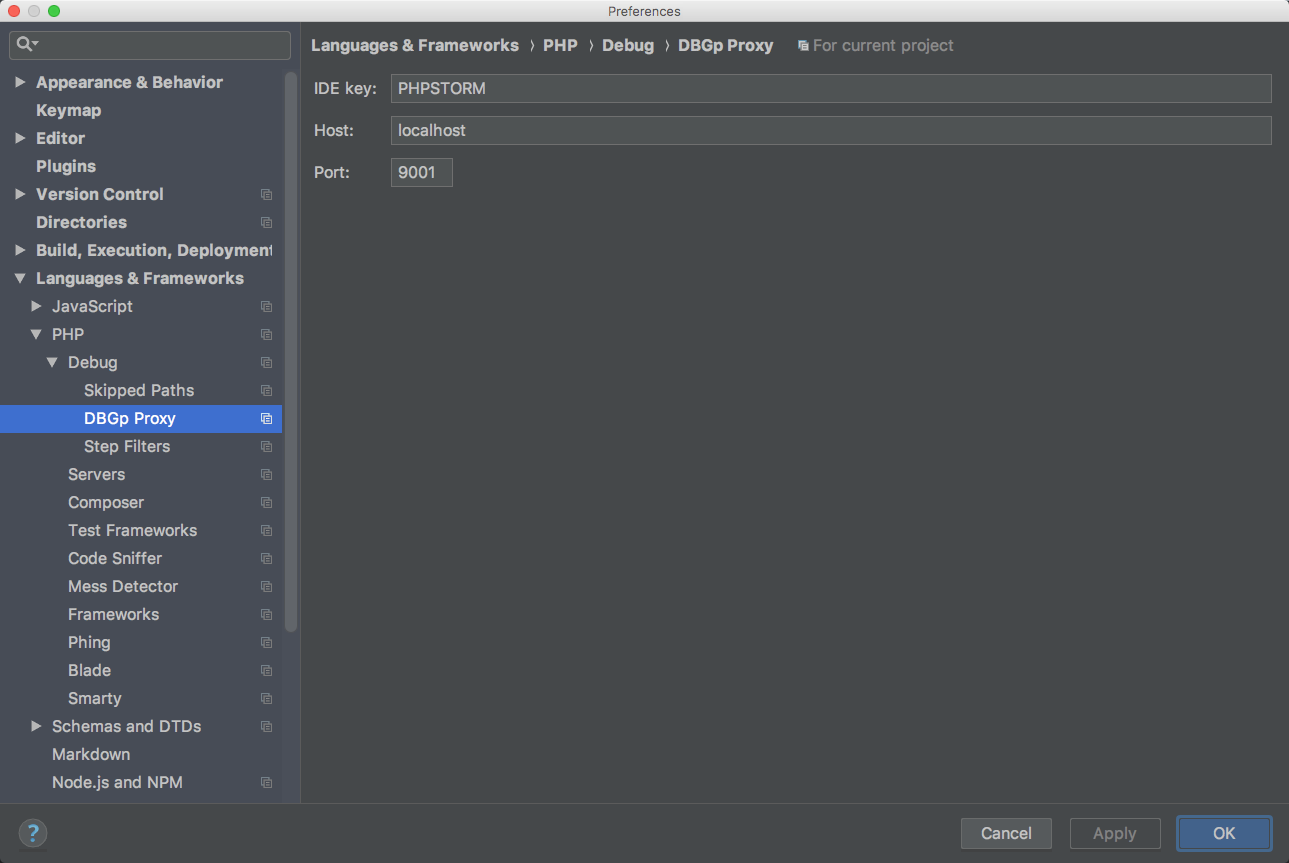
2、设置 PhpStorm Key、主机以及端口
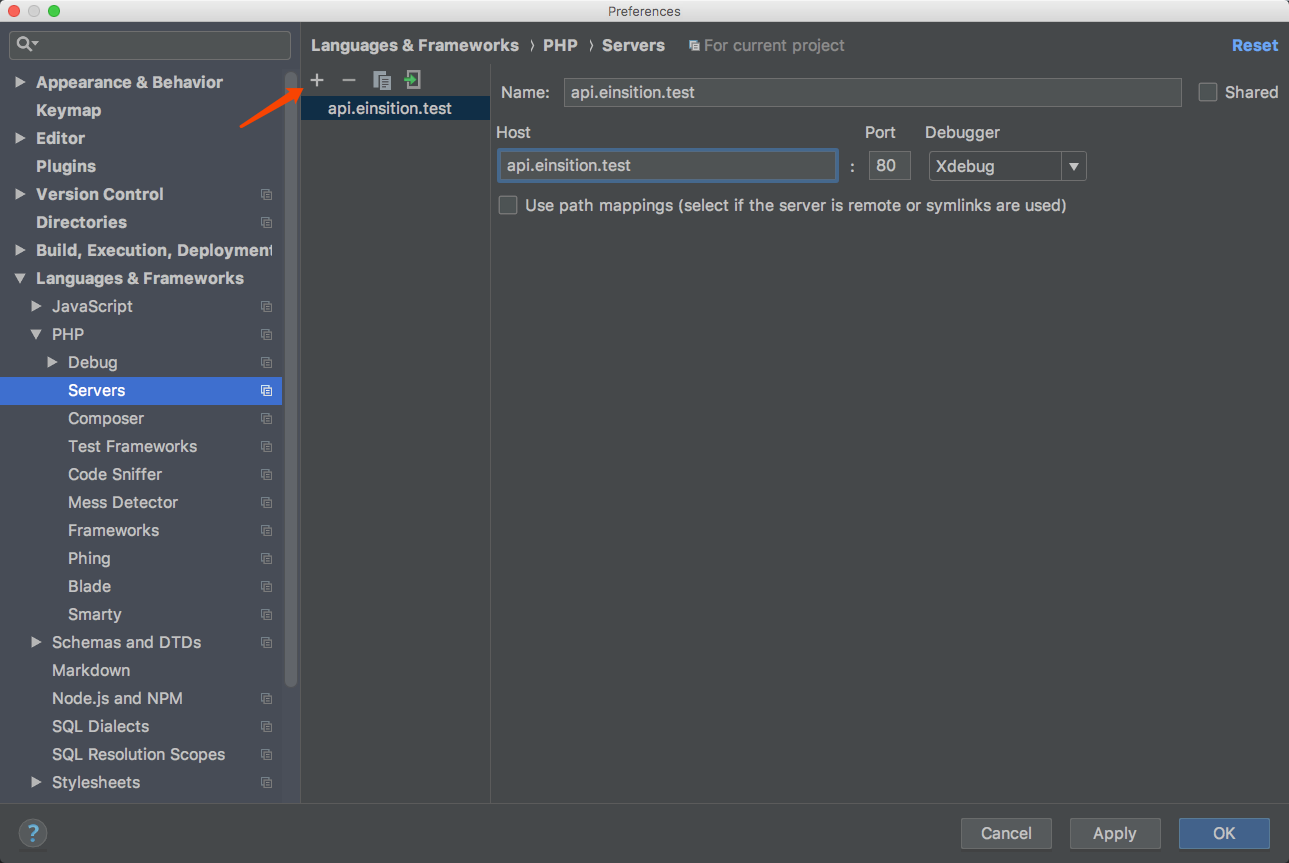
3、新建 Xdebug 服务
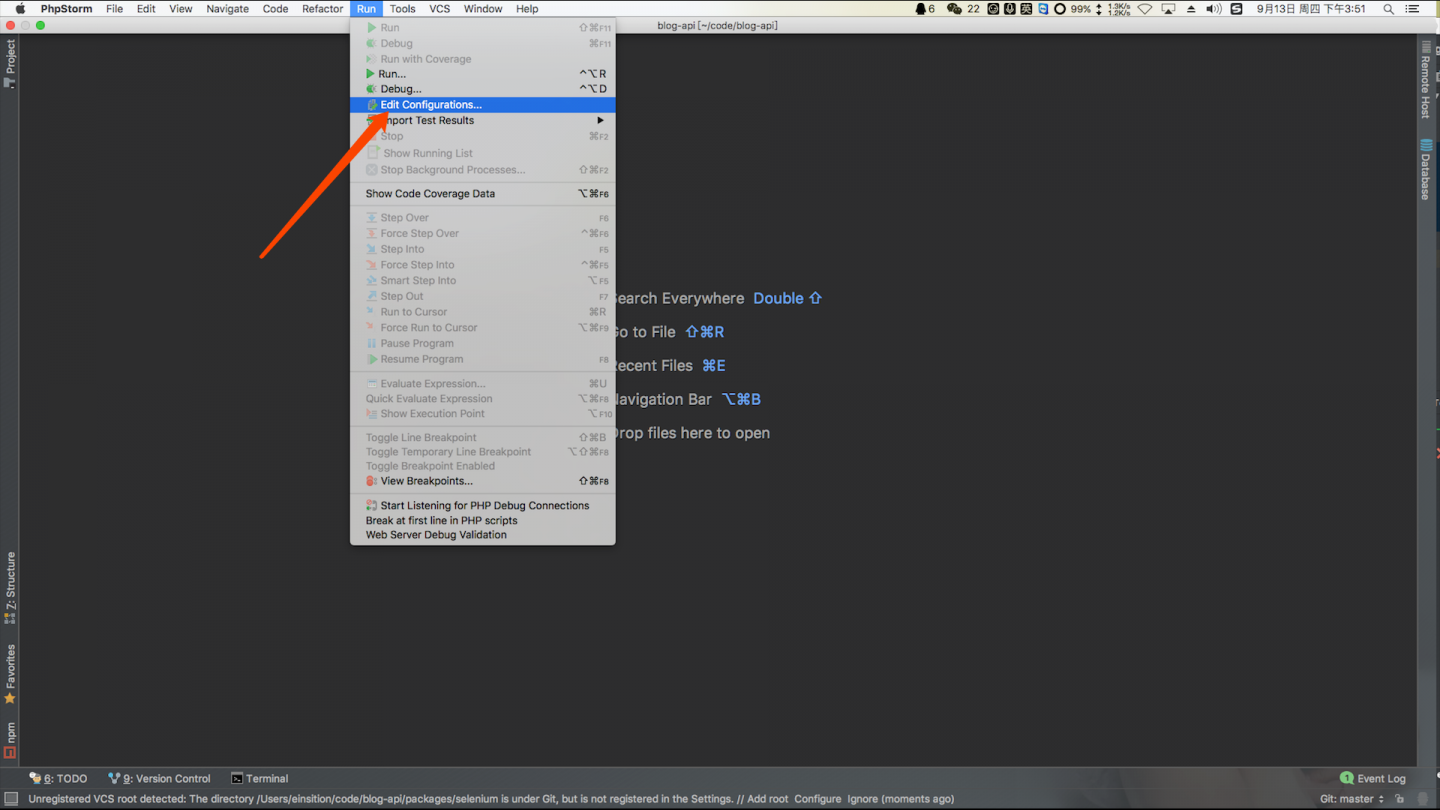
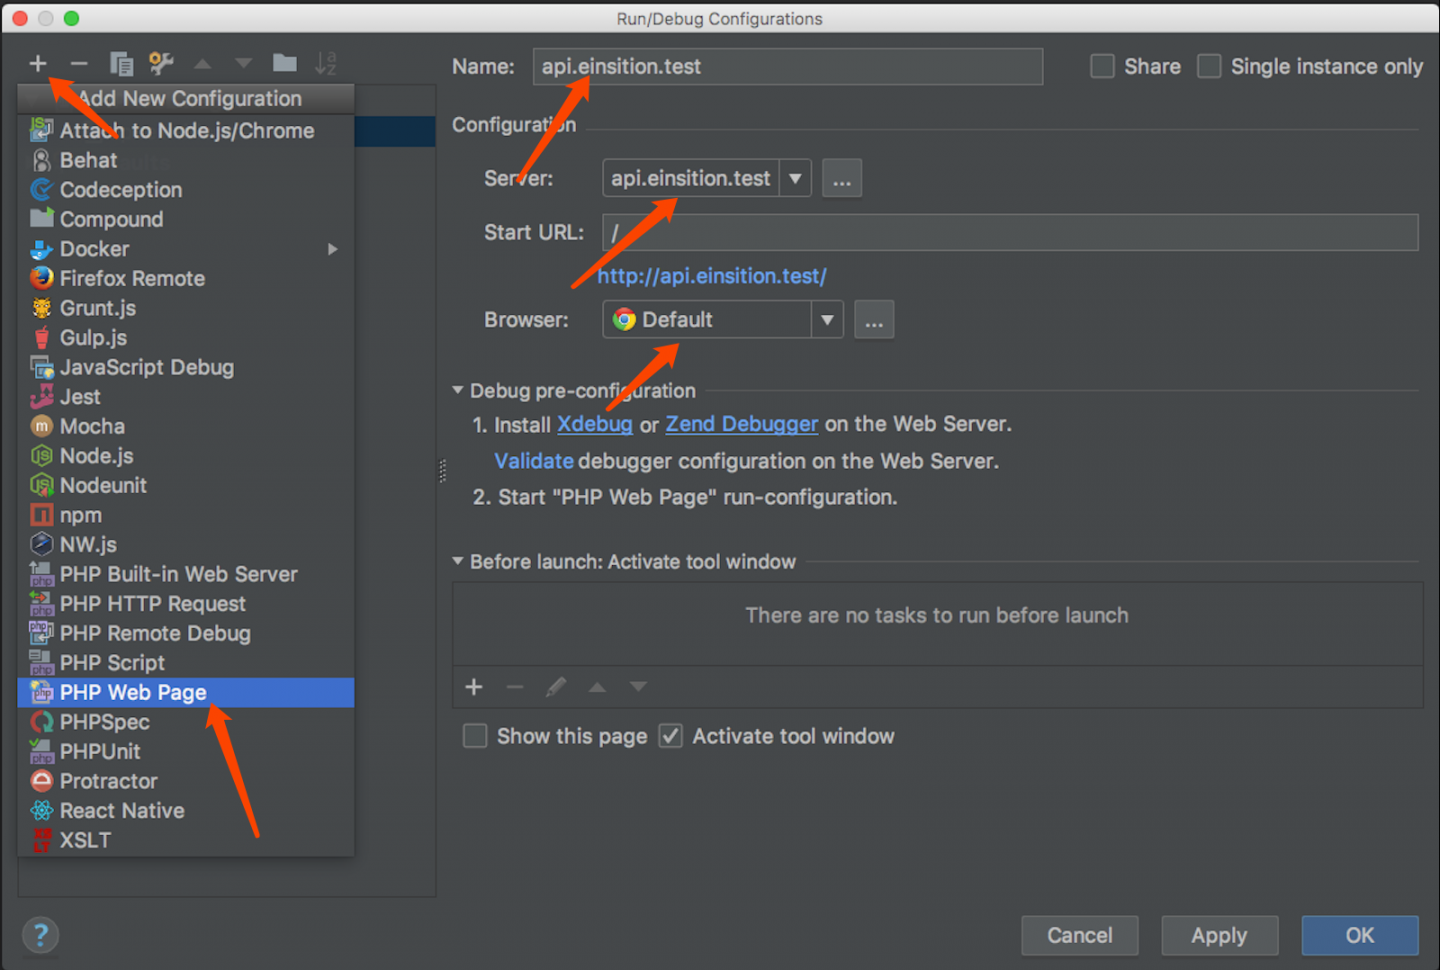
4、配置 Xdebug 调试接口
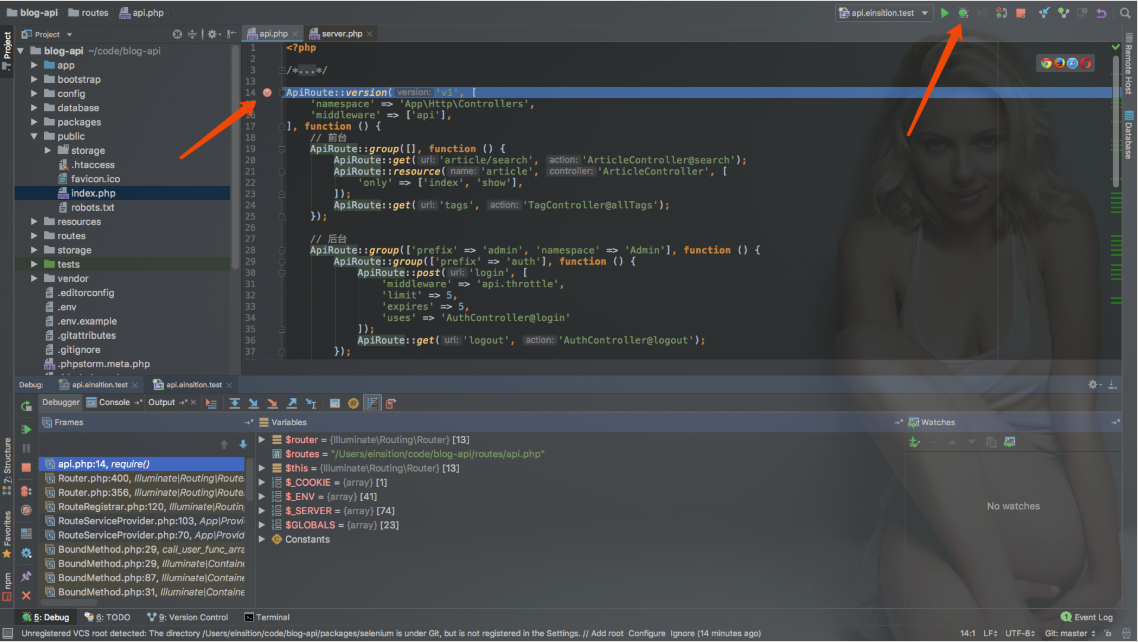
四、运行测试
本作品采用《CC 协议》,转载必须注明作者和本文链接


 关于 LearnKu


推荐文章: