
k-邻近算法实现约会网站的配对效果
0 / 0 / 创建于 6年前 /
 娃哈哈店长 的个人博客
k- 近邻 (k-NearestNeighbor,kNN) 分类算法是数据挖掘分类技术中最简单的方法之一。K- 近邻算法是通过测量不同特征值之间的距离进行分类的。基本思路是:如果一个样本在特征空间中的k 个最邻近样本中的大多数属于某一个类别,则该样本也属于这个类别。该方法在决定类别上只依据最近的一个或几个样本的类别来决定待分类样本所属的类别。KNN 算法中,所选择的邻居都是已经正确分类的对象。该方法在分类决策上只依据最邻近的一个或几个样本的类别来决定待分类样本所属的类别。
knn算法详解:https://boywithacoin.cn/article/fen-lei-su...
案例概要:女主海伦一直使用约会网站找合适自己的约会对象,但是一直没找到合适的人。通过收集找过的约会对象来构造分类器。
经过一番总结,发信以前交往过三种类型的人:
- 不喜欢的人-代码0
- 魅力一般的人-代码1
- 极具魅力的人-代码3
海伦希望通过分类软件可以更好地帮助她将匹配对象划分到确切地分类中
0x00 收集/准备数据
案例数据收集:每个人收集三个特征,分别是每年飞行常客的时间(每年乘坐飞机的时间、玩电子游戏的时间比、每周吃冰淇淋的公升数,如下表所示(我也不知道为啥要分这三类、例题里这样写的)。
| 序号 | 飞行公里数 | 玩游戏所占时间百分比 | 吃冰淇淋公升数 | 样本标签 |
|---|---|---|---|---|
| 1 | 40920 | 8.3 | 0.9 | 3 |
| 2 | 14488 | 7.1 | 1.6 | 2 |
| 3 | 26052 | 1.4 | 0.8 | 1 |
| 4 | 75136 | 13.1 | 0.42 | 1 |
整理测试数据集:
显示信息分别为飞行公里数、玩游戏所占比例、吃冰淇淋公升数、样本标签。
数据集下载地址:https://github.com/Freen247/database/blob/...
40920   8.326976    0.953952    3
14488   7.153469    1.673904    2
26052   1.441871    0.805124    1
75136   13.147394   0.428964    1
38344   1.669788    0.134296    1
72993   10.141740   1.032955    1
35948   6.830792    1.213192    3
42666   13.276369   0.543880    3
67497   8.631577    0.749278    1
.....(共准备1000条测试数据)
0x01 设计算法分析数据
通过文件名获取测试数据集
构造knn算法类,设计file2matrix方法来通过文件名获取数据集,分别处理为
- 二位数组:存储前三位属性的位置分别是飞行公里数、玩游戏所占比例、吃冰淇淋公升数
-
单list:存储每个样本属性后的标签,是什么属性的类别的人
#!/usr/bin/python
# -*- coding: utf-8 -*-
#__author__ : stray_camel
#pip_source : https://mirrors.aliyun.com/pypi/simple
import sys,os
import numpy as np
import operator # Operator module
'''
k-Nearest Neighbor,KNN
'''
class KNN_test():
def __init__(self,
absPath:dict(type = str, help="Directory of the current file") = os.path.dirname(os.path.abspath(__file__)),
):
    self.absPath = absPath

# Open file by file name to get test data
def file2matrix(self,
filename : dict(type = str, help="Relative path and name of the file"),
)->dict(type=(np.array,list), help=('The two-dimensional array stores the first three digits of the sample data', 'and the list stores the tags of the sample data (type of person)')):
    fr = open(self.absPath+'/'+filename)
    arrayOLines = fr.readlines()
    # get the number of data lines
    numberOfLines = len(arrayOLines)
    # Create a return matrix
    returnMat = np.zeros((numberOfLines, 3))
    classLabelVector = []
    index = 0
    for line in arrayOLines:
        # Remove whitespace
        line = line.strip()

        # split specifies the separator to slice the data
        # '\t' means to jump horizontally to the next tab position '\r' means enter '\n' means carriage return and line feed
        listFromLine = line.split('\t')

        # Select the first 3 elements (features) and store them in the returned matrix
        returnMat[index, :] = listFromLine[0:3]

        classLabelVector.append(int(listFromLine[-1]))
        # The -1 index indicates the last column of elements, and the bit 'label' information is stored in the 'classLabelVector'

        index += 1
    return returnMat, classLabelVector
测试一下代码:
if __name__ == "__main__":
    test = KNN_test()
    # print(test.file2matrix.__annotations__)
    print(test.file2matrix('datingTestSet2.txt'))
运行结果:
(array([[4.0920000e+04, 8.3269760e+00, 9.5395200e-01],
       [1.4488000e+04, 7.1534690e+00, 1.6739040e+00],
       [2.6052000e+04, 1.4418710e+00, 8.0512400e-01],
       ...,
       [2.6575000e+04, 1.0650102e+01, 8.6662700e-01],
       [4.8111000e+04, 9.1345280e+00, 7.2804500e-01],
       [4.3757000e+04, 7.8826010e+00, 1.3324460e+00]]), [3, 2, 1, 1,...(共一千条), 3, 3])
4.0920000e+04 表示为 4.0920000*10^4
通过数据集获取欧氏距离
从样表中的数据可以得知,如果要计算样本2和3之间的距离,使用欧氏距离:

将k-邻近算法计算距离用python来实现:
    # get Euclidean distance
    def  get_Euclidean_distance(self,
    a : dict(type = np.array,help = "Normalized data set"),
    dataSet : dict(type = np.array, help = "The two-dimensional array stores the first three digits of the sample data"),
    labels : dict(type=list, help="Actual labeling of test sample data"),
    k : dict(type = int, help = "Number of nearest neighbors") ):
        # get the length of the first dimension维度 of the data matrix, Which is the length of each dimension
        dataSetSize = dataSet.shape[0]

        # tile repeating array 'a', with dataSet rows and 1 dataSet column, subtraction calculation difference
        diffMat = np.tile(a, (dataSetSize, 1)) - dataSet

        # **means the power operation, the Euclidean distance used here
        sqDiffMat = diffMat ** 2

        # default parameters of Ordinary 'sum' are axis = 0 for ordinary addition, and axis = 1 for row vector addition of one row
        sqDisttances = sqDiffMat.sum(axis =1)

        # argsort() returns the index via value from samll to large(array index 0, 1, 2,3)
        distances = sqDisttances ** 0.5
        sortedDistIndicies = distances.argsort()

        # Select 'k' points with the smallest distance
        classCount = {}
        for _ in range(k):
            # Returns the first k labels that are close according to the index value of the sorted result
            voteIlabel = labels[sortedDistIndicies[_]]
            classCount[voteIlabel] = classCount.get(voteIlabel, 0) + 1

        # Sorting frequency
        sortedClassCount = sorted(classCount.items(), key = operator.itemgetter(1), reverse = True)

        # return the most frequent
return sortedClassCount[0][0]numpy.tile():https://docs.scipy.org/doc/numpy/reference...
很容易发现,上面方程中数字差值最大的属性对计算结构的影响是最大的,也就是说,每年玩游戏所占百分比和每周吃冰淇淋公升数的影响要远远小于每年飞行的公里数的影响。产生这种现象的原因,仅仅是飞行里程数远远大于其他特征值。但是这3种特征值同等重要,有相同的权重,飞行里程数不该如此严重地影响计算结果。
将上述数据进行归一化
如果将特征值全部转化为一个小区间内,那么计算结果将不会受到特征值大小的影响,通常将这种方法称为数值统一化。
下面公式将任意取值方位的特征值转化为0-1区间内的值
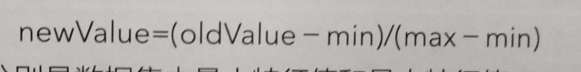
其中min和max分别表示数据集的最小特征值和最大特征值
传入数据集,将之前存储三个数据属性的二维数组传入,进行归一化后传出归一化的数据集1000*3*1矩阵,和数据集中最大值和最小值的差1*3矩阵,数据集中最小值的1*3矩阵
下面是实现归一化的python源码:
    # Normalized eigenvalues 归一化特征值
    # Normalization formula公式: ('current value'-'minimum value') / range
    def autoNorm(self,
    dataSet : dict(type = np.array, help="The two-dimensional array stores the first three digits of the sample data"),
    )->dict(type=(normDataSet, ranges, minVals),help=("Normalized data matrix 1000 * 3 * 1", "maximum value minus minimum value data matrix 1 * 3", "matrix formed by minimum value in data set 1 * 3")):

        # stores the minimum value of each column, parameter 0 makes it possible to select the minimum value from the column instead of the current row
        minVals = dataSet.min (0)

        # stores the maximum value of each column
        maxVals = dataSet.max (0)
        ranges = maxVals-minVals

        # initialize the normalization matrix to the read dataSet
        normDataSet = np.zeros(shape (dataSet))

        # m holds the first row
        # The feature matrix is 3x1000, and the min max range is 1x3. Therefore, the content of the variable is copied into the input matrix with the same size as the tile.

        m = dataSet.shape [0]
        normDataSet = dataSet-tile (minVals, (m, 1))
        normDataSet = normDataSet / tile (ranges, (m, 1))
        return normDataSet, ranges, minVals
0x02 测试/使用算法
测试分类器和运行结果
下面将测试分类器的运行效果,如果分类器的正确率满足要求,就可以使用这个软件来处理约会网站提供的约会名单。通常只使用数据集中百分之九十的样本作为训练样本来训练分类器,而使用其余百分之十的数据去测试分类器。
下面python源码用来测试约会网站分类器的性能。
    # Test Dating Site Classification Results Code
    def datingClassTest(self):
        hoRatio = 0.10  # hold out 10%
        datingDataMat, datingLabels = self.file2matrix('/datingTestSet2.txt')  # load data setfrom file
        normMat, ranges, minVals = self.autoNorm(datingDataMat)
        m = normMat.shape[0]
        numTestVecs = int(m * hoRatio)
        errorCount = 0.0
        for i in range(numTestVecs):
            classifierResult = self.get_Euclidean_distance(normMat[i, :], normMat[numTestVecs:m, :], datingLabels[numTestVecs:m], 3)
            print("分类器返回的值: %s, 正确的值: %s" % (classifierResult, datingLabels[i]))
            if (classifierResult != datingLabels[i]): errorCount += 1.0
        print("总的错误率是: %f" % (errorCount / float(numTestVecs)))
        print("错误的个数:%f" % errorCount)
测试一下分类器的效果:
if __name__ == "__main__":
    test = KNN_test()
    # print(test.file2matrix.__annotations__)
    test.datingClassTest()
运行结果:
分类器返回的值: 3, 正确的值: 3
...(测试数据百分之十,大概100条数据)...
分类器返回的值: 3, 正确的值: 1
总的错误率是: 0.050000
错误的个数:5.000000
分类器处理数据的的错误率是百分之2,结果还是比较不错的,表明可以预测分类。
手动输入的方式输入测试数据集
# Complete Dating Website Prediction: Given a person, determine when it is suitable for dating
    def classifyPerson(self):
        resultList = ['不喜欢', '一般喜欢', '特别喜欢']
        percentTats = float(input("玩游戏占的百分比"))
        ffMiles = float(input("每年坐飞机多少公里"))
        iceCream = float(input("每年吃多少公升的冰淇淋"))
        datingDataMat, datingLabels = file2matrix('datingTestSet2.txt')
        normMat, ranges, minVals = autoNorm(datingDataMat)
        inArr = array([ffMiles, percentTats, iceCream])
        classifierResult = classify0((inArr - minVals) / ranges, normMat, datingLabels, 3)

print("你将有可能对这个人是:", resultList[int(classifierResult) - 1])本作品采用《CC 协议》,转载必须注明作者和本文链接


 关于 LearnKu


