
Phpstorm + Docker + Postman 配置 Xdebug
37 / 1 / 创建于 5年前 /
 邢闯洋 的个人博客
前言
日常开发调试过程中,我们经常需要打断点调试,非常的不方便,如果要配上 Xdebug 这种工具,就很舒服了
安装
一、安装Xdebug
我使用的是 Docker 环境,用的是 Github 上的 dnmp 项目,安装 Xdebug 的链接:安装Xdebug
二、配置 Xdebug
1、修改 php.ini 文件
[XDebug]
zend_extension=xdebug.so
xdebug.remote_enable=1
xdebug.remote_handler="dbgp"

# docker推荐采用如下形式表示和phpstorm所在机器的ip(如果你的phpstorm装在宿主机那就是宿主机的ip)
xdebug.remote_host=host.docker.internal
xdebug.remote_port=9000
xdebug.remote_log=/var/log/php/xdebug.log
xdebug.idekey=PHPSTORM

;启用代码自动跟踪
xdebug.auto_trace = On
;启用性能检测分析
xdebug.profiler_enable = On
xdebug.profiler_enable_trigger = On
xdebug.profiler_output_name = profiler.out.%t.%p
2、查看 phpinfo 是否安装成功
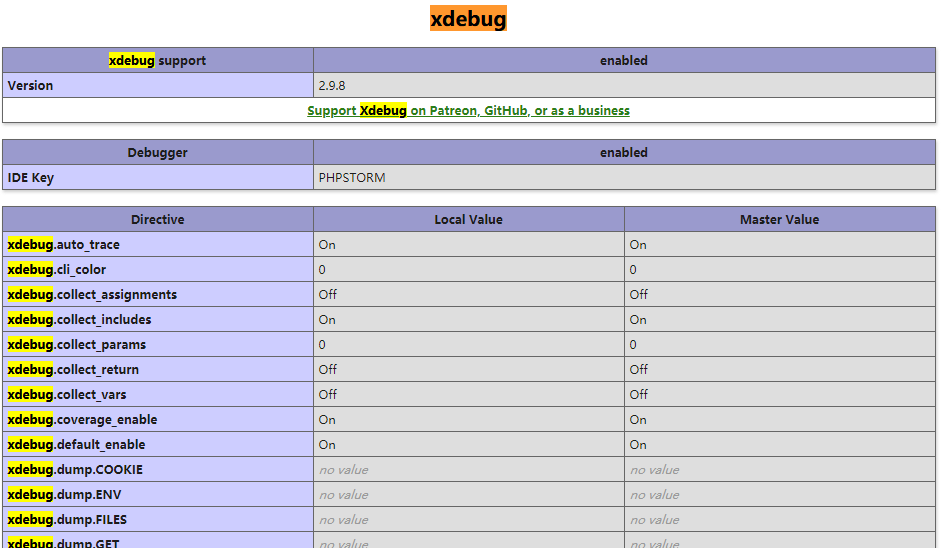
三、配置 Phpstorm
1、进入 Languages & Frameworks > PHP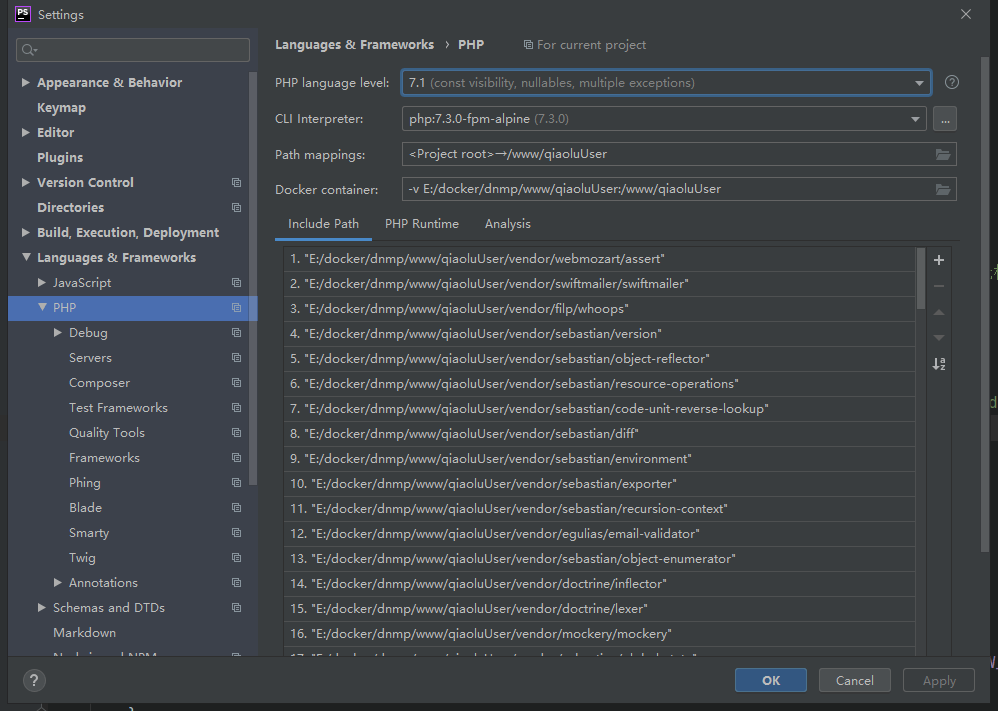
2、进入CLI Interpreter选择PHP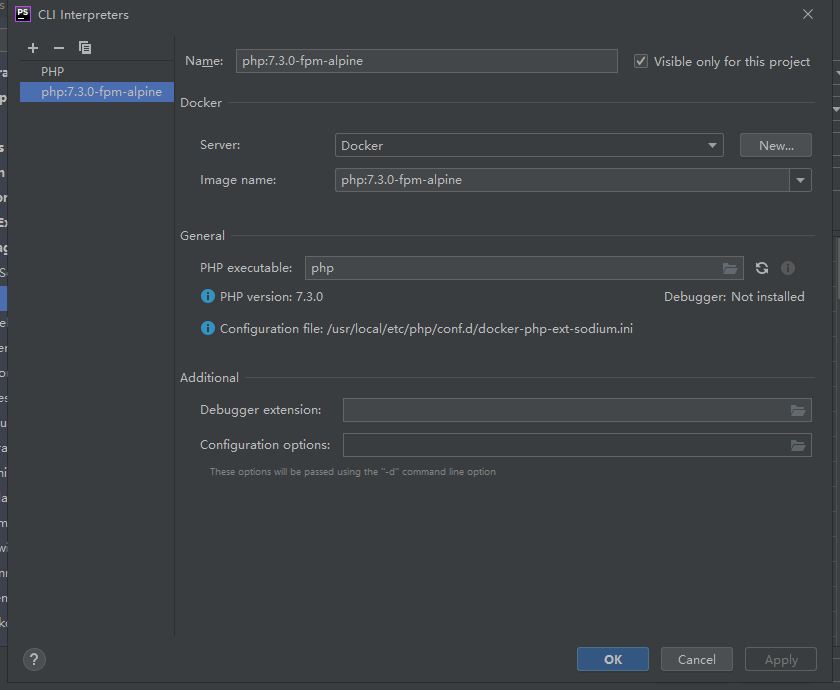
3、进入Docker Server选择进行连接Docker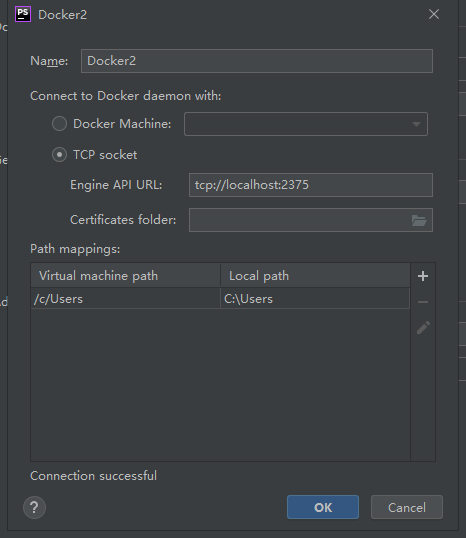
必须是 Connection successful 状态
4、Debug 端口配置
4.1、进入 Languages & Frameworks > PHP > Debug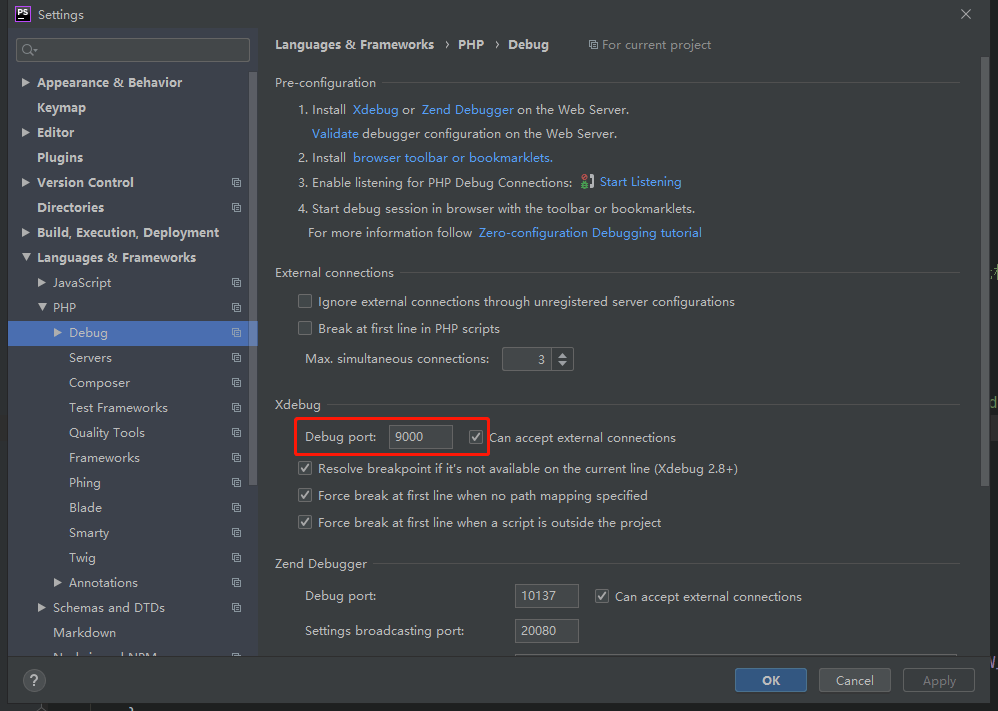
4.2、配置 Server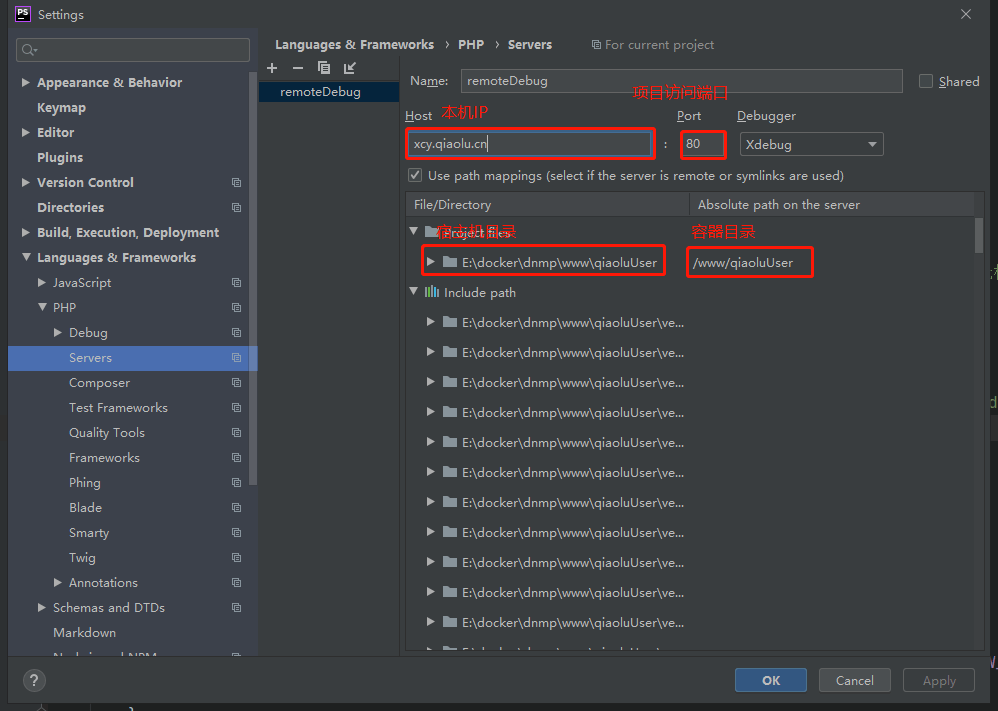
4.3、Run -> Edit Configuration 或者 或者点击 PHPstorm 右上角的 Edit Configuration
新增一个 PHP Remote Debug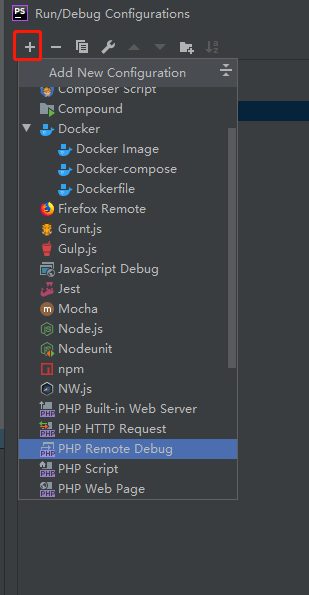
配置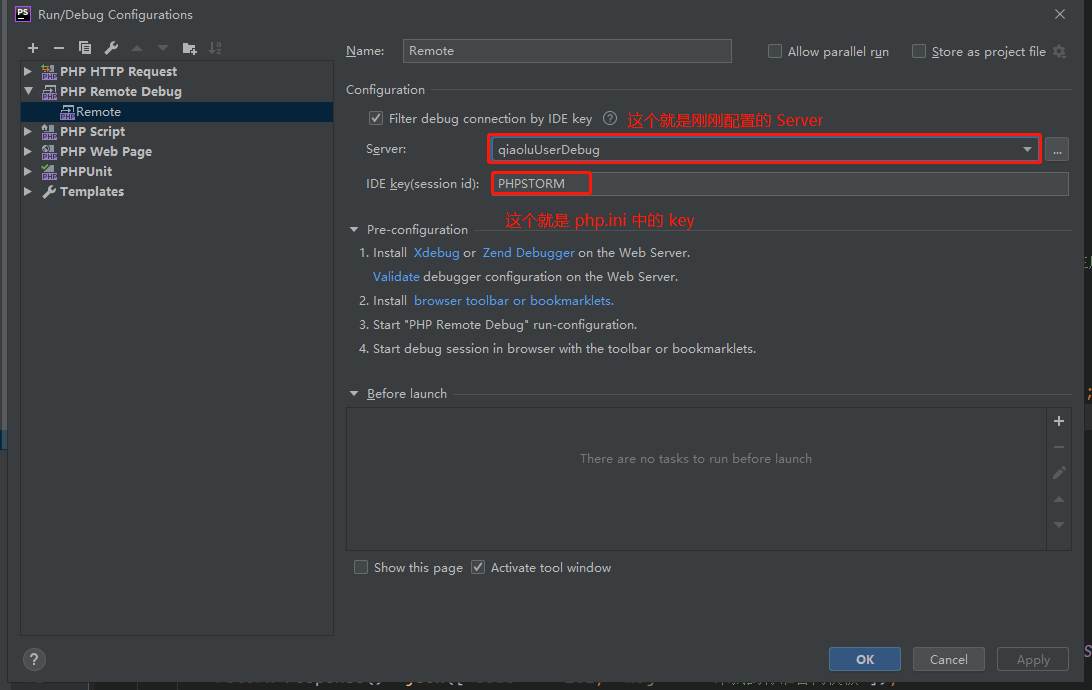
四、使用 Postman 开始调试
1、开启 Phpstorm Xdebug 监听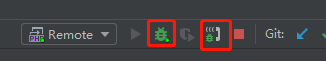
2、配置 Postman
2.1、 在 Header 中添加 Cookie 参数
XDEBUG_SESSION=PHPSTROM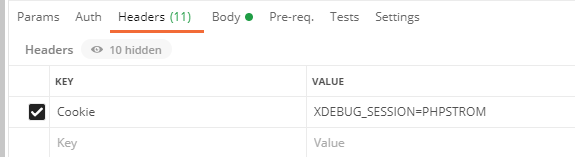
执行请求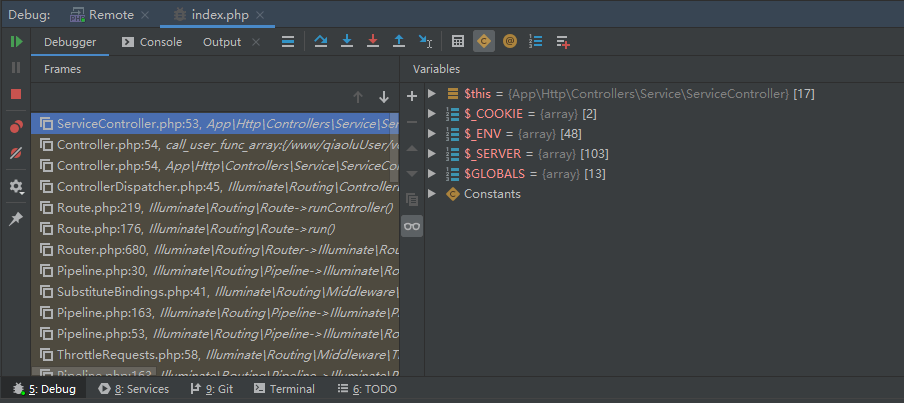
五、使用 Web 调试
1、在 Google 浏览器插件市场中下载 Xdebug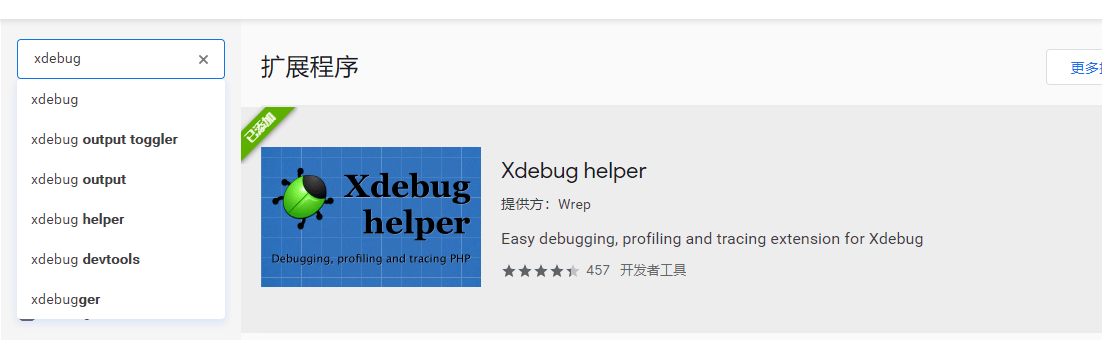
2、右键点击 Xdebug 图标选择选项点击进入配置页面
将 IDE Key 设置完整保存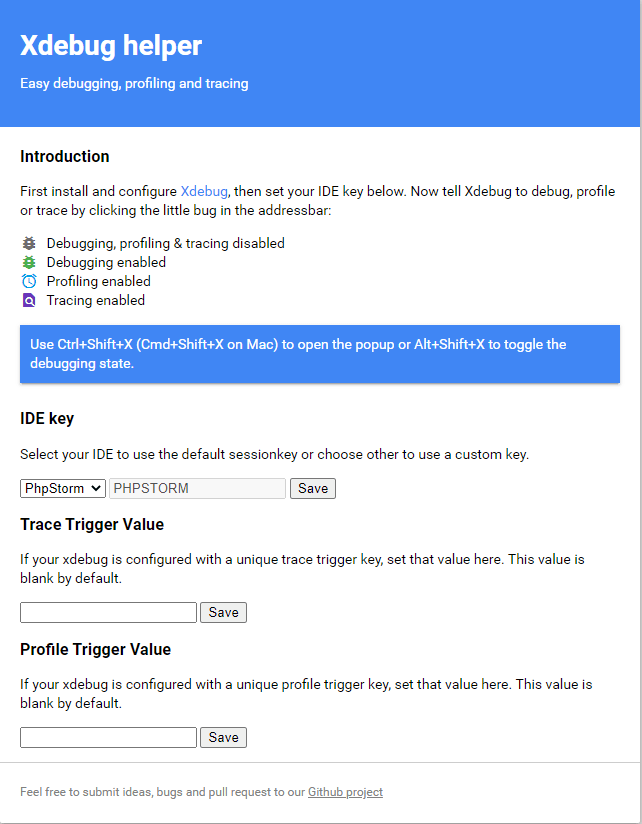
3、在浏览器中输入即将调试的接口地址,在点击 左键点击Xdebug图标,点击 Debug 按钮将 Xdebug 变为绿色
下列为参考文章
本作品采用《CC 协议》,转载必须注明作者和本文链接


 关于 LearnKu


推荐文章: