
基于 go pprof 与 go trace 进行持续性能剖析
0 / 0 / 创建于 4年前 /
 摇摆的小虎牙 的个人博客
Profiler 是一个基于 go pprof 与 go trace 持续性能剖析工具
- 样本采集
tracefgprofprofilemutexheapgoroutineallocsblockthreadcreate
- 配置动态加载
- 根据配置文件收集目标服务的样本, 收集程序会监听配置文件的变化,即时应用变化后的配置文件
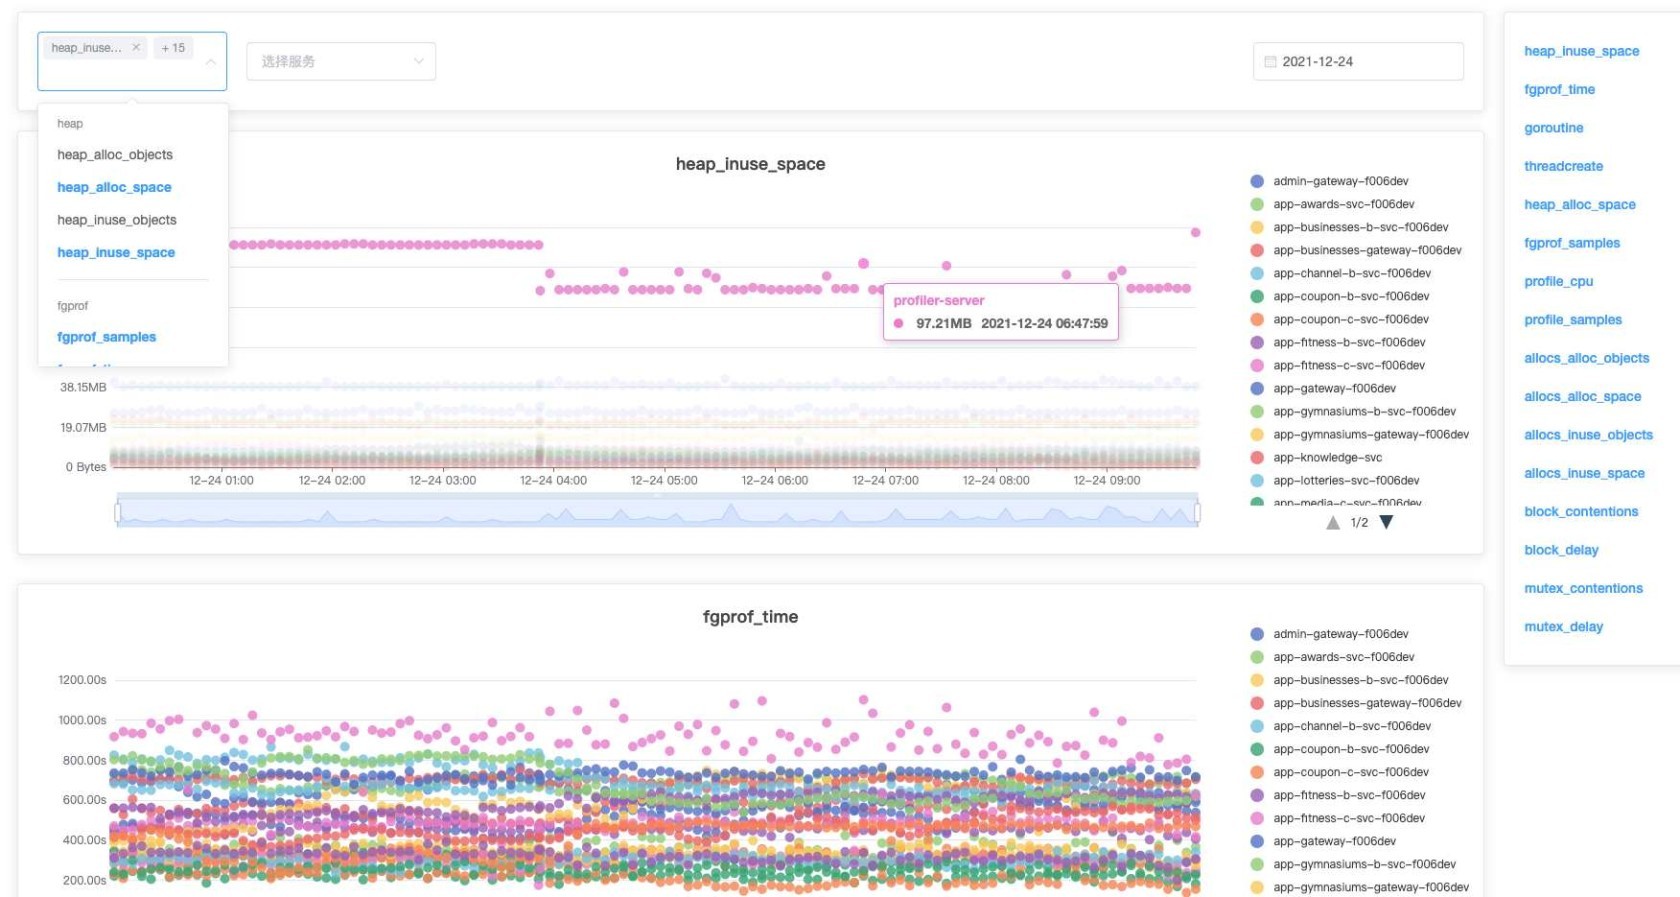
- 图表趋势
- 提供图表观测多个服务性能指标的趋势,找出性能问题的时间点
- 每一个气泡都是一份 Profile 与 Trace 的样本文件
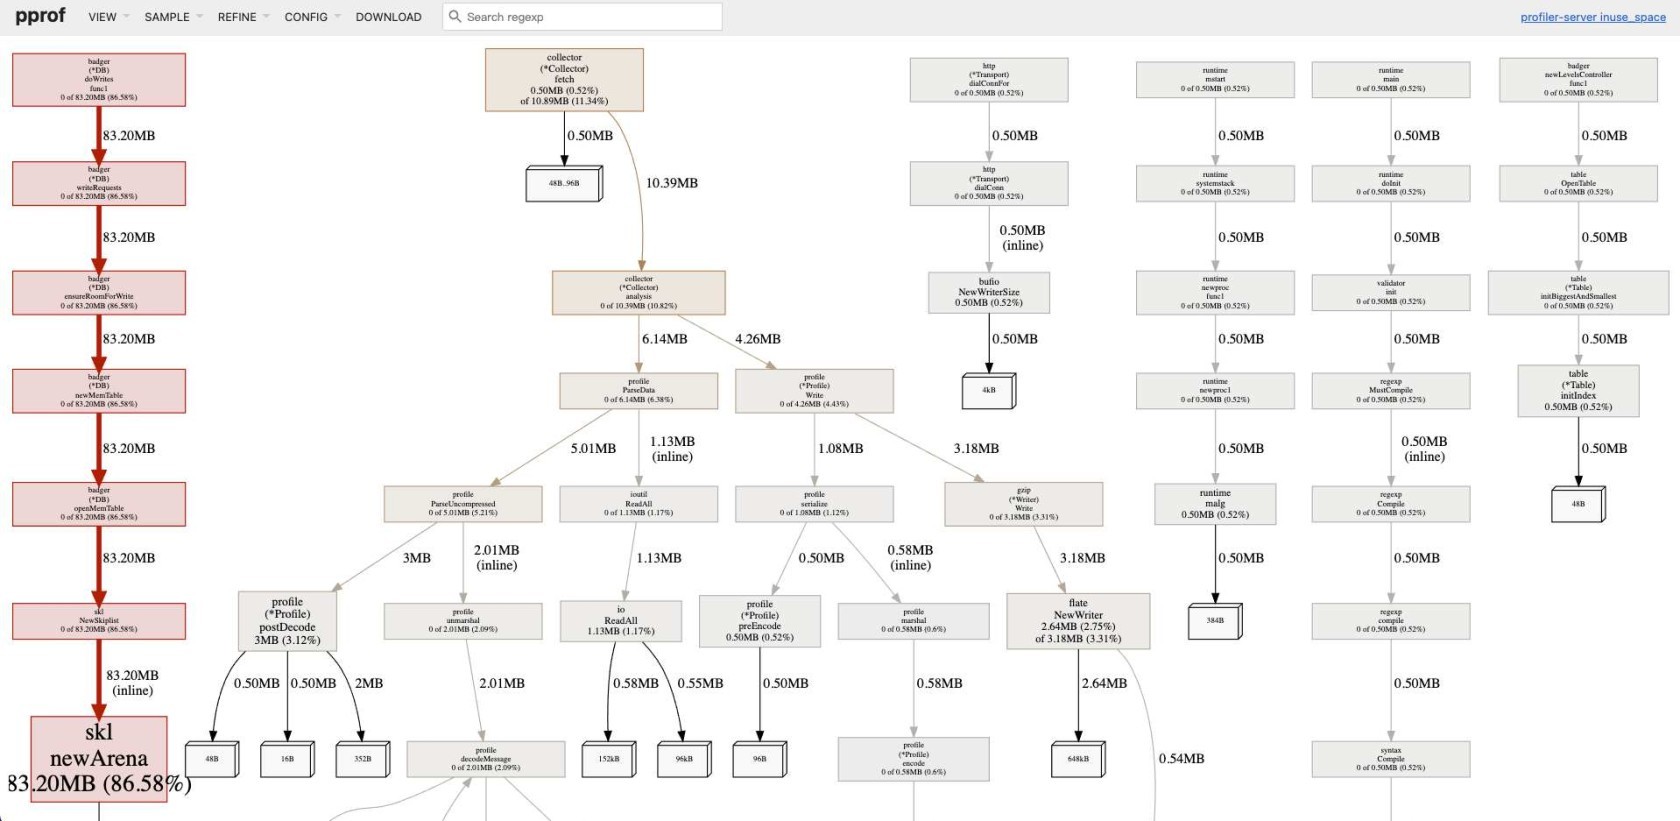
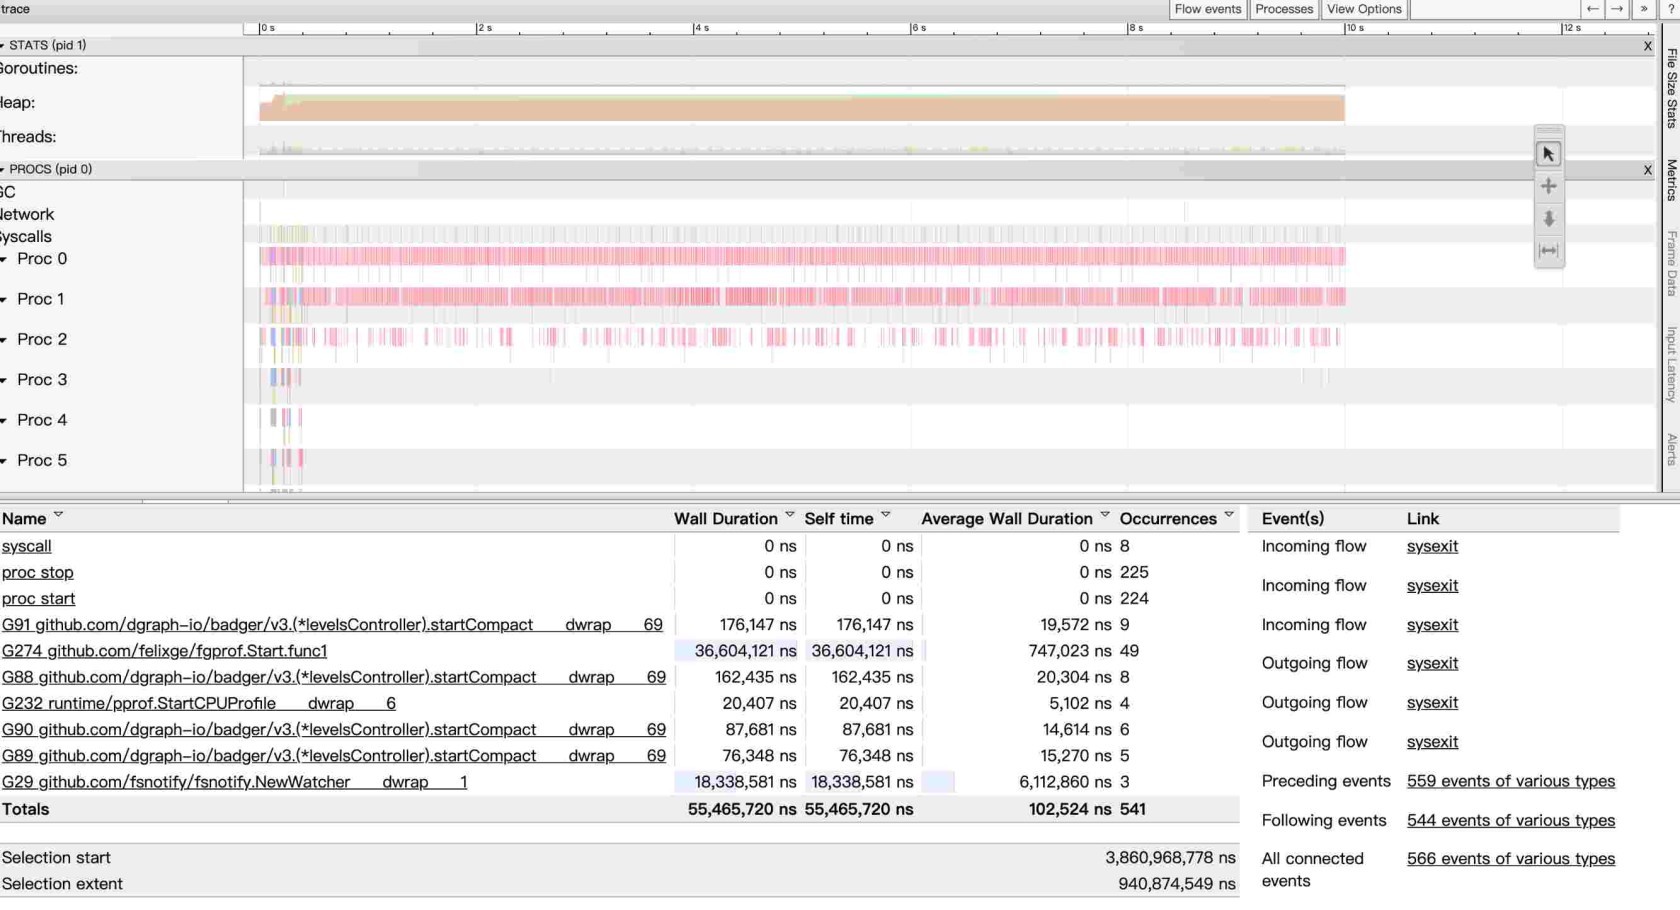
- 详细分析
- 点击图表中的气泡跳转到 Profile 与 Trace 的详细页面进行进一步详细的分析点击
chart中的气泡跳转到pprof与trace的详细页面进行进一步详细的分析
- 点击图表中的气泡跳转到 Profile 与 Trace 的详细页面进行进一步详细的分析点击
| 图表趋势 | 点击气泡跳转 Profile 详情 |
 |
 |
| 点击气泡跳转 Trace 详情 | 点击气泡跳转 Trace 详情 |
 |
 |
快速入门
本地启动
# run server :8080
go run server/main.go

# run ui :80
cd ui && npm install --registry=https://registry.npm.taobao.org && npm run dev --base_api_url=http://localhost:8080
In Docker
# 无持久化
docker run -d -p 80:80 --name profiler xyctruth/profiler:latest

# 持久化
mkdir -vp ~/profiler/config/
cp ./collector.yaml ~/profiler/config/
docker run -d -p 80:80 -v ~/profiler/data/:/profiler/data/ -v ~/profiler/config/:/profiler/config/ --name profiler xyctruth/profiler:latest
抓取配置
需要被收集分析的 golang 程序,需要提供 net/http/pprof 端点,并配置在 ./collector.yaml 配置文件中。
配置文件可以在线更新,收集程序会监听配置文件的变化,即时应用变化后的配置文件。
collector.yaml
collector:
  targetConfigs:

    profiler-server:        # 目标名称
      interval: 15s         # 抓取间隔
      expiration: 0         # 无过期时间
      host: localhost:9000  # 目标服务host
      profileConfigs:       # 使用默认配置

    server2:
      interval: 10s
      expiration: 168h      # 过期时间7天
      host: localhost:9000
      profileConfigs:       # 覆盖部分默认配置字段
        trace:
          enable: false
        fgprof:
          enable: false
        profile:
          path: /debug/pprof/profile?seconds=10
          enable: false
        heap:
          path: /debug/pprof/heap
profileConfigs 默认配置
profileConfigs:
  profile:
    path: /debug/pprof/profile?seconds=10
    enable: true
  fgprof:
    path: /debug/fgprof?seconds=10
    enable: true
  trace:
    path: /debug/pprof/trace?seconds=10
    enable: true
  mutex:
    path: /debug/pprof/mutex
    enable: true
  heap:
    path: /debug/pprof/heap
    enable: true
  goroutine:
    path: /debug/pprof/goroutine
    enable: true
  allocs:
    path: /debug/pprof/allocs
    enable: true
  block:
    path: /debug/pprof/block
    enable: true
  threadcreate:
    path: /debug/pprof/threadcreate
    enable: true
项目地址
本作品采用《CC 协议》,转载必须注明作者和本文链接


 关于 LearnKu


