
《让PHP扩展开拓编程前路》 之 性能分析利器 xhprof
55 / 2 / 创建于 3年前 /
 Tacks 的个人博客
- Title: 《让PHP扩展开拓编程前路》 之 性能分析利器
xhprof - Tag:
PECL、PHP、Profiler、xhprof、性能分析 - Author: Tacks
- Create-Date: 2023-05-16
- Update-Date: 2023-05-18
目录
Ref
- Wiki Profiling 性能分析
- PECL xhprof
- PHP xhprof
- PHP xhprof_enable() 启动 xhprof 性能分析器
- PHP xhprof_disable() 停止 xhprof 性能分析器
- Github longxinH/xhprof (PHP7/PHP8上可用 目前仍在更新)
- Github webman-php/xhprof (webman 引入 xhprof)
- Github phacility/xhprof (PHP5上可用,不支持在PHP7上)
- Github patrickallaert/xhprof (PHP7.0/PHP7.1/PHP7.2/PHP7.3上可用 停止更新)
- Github preinheimer/xhprof
- Github perftools/php-profiler 数据采集分析
- Github perftools/xhgui GUI性能分析可视化 xhgui的原版
- Github laynefyc/xhgui-branch GUI性能分析可视化 xhgui的汉化版
- Github laynefyc/php-monitor GUI性能分析可视化 xhgui的汉化升级版 采用VUE实现
- Github lox/xhprof (已废弃)
- Blog @facebook 2009 年开源 xhprof (已废弃)
- Packagist facebook/xhprof (已废弃)
- Blog Profiling 代码分析,一种提高 PHP 性能的技术
1、Intro
1.1 xhprof 的发展
PHP 扩展
xhprof是一个轻量级的分层性能测量分析器,最开始由facebook/xhprof,用于分析和优化 PHP WEB 网站,在2009年开源,大概2015年不再维护,facebook/xhprof代码转到lox/xhprof仓库维护。后来基于XHProf分支。从PECL上可以看到xhprof扩展,不过中途也是有更换开发者,2013 年最新版到0.9.4是由 phacility/xhprof 仓库维护,当时主要是PHP5.x系列,随着PHP7.x系列的更新,PHP底层数据类型实现进行优化,之前xhprof版本无法在PHP7.x上运行,于是更换成longxinH/xhprof,截至目前 2023年05月xhprof最新版本是2.3.9。还好后继有人,xhprof依然活跃,可谓是xhprof的第二世!第三世其实是tideways_xhprof,当然本文暂且先不讨论tideways相关扩展。
XHProf扩展 是 PHP 的函数级层次分析器,具有简单的基于 HTML 的可视化界面。原始数据收集组件是用 C 语言实现的(作为 PHP 扩展)。性能分析展示层全部使用 PHP。它能够报告函数级包含和独占的挂起时间、内存使用情况、CPU 时间和每个函数的调用次数,以及整个的函数调用图。
当然 xhprof 有很多衍生的版本项目,虽然他们名字可能一样,但可能不是同一套代码,因此建议直接去看 Github 上的代码。
本文讨论的 xhprof 扩展来源如下
PECL上2.3.9Github上 longxinH/xhprof
1.2 什么是 Profiler 分析器 ?
Profiler 分析器是一种用于监控并优化程序性能的工具,它可以找出应用程序中的性能瓶颈,从而帮助开发人员提高程序的响应速度和性能。
通常来说,它可以收集程序执行期间的各种指标和性能数据,包括但不限于,CPU使用率、内存使用情况、函数执行时间等,然后生成详细的性能分析报告,以及可视化的图表展示。
- 工具选择
- PHP 中,比如有
xdebug、xhprof、tideways - 其他语言,如 Go 中,比如
pprof、dlv、go-torch等
- PHP 中,比如有
- 工具集成
- 应用程序执行
- 工具收集数据
- 可视化报告展示
- 函数调用频次
- 函数调用关系、调用链
- 函数执行耗时
- 函数内存消耗
- 火焰图
Flame Graph - 堆栈图
Call Graph - …
2、Prepare
2.1 我的环境
PHP 7.3.20没有是最新的是因为我太懒,晚点换
[root@Centos7 ~]# php -v
PHP 7.3.20 (cli) (built: Jan 11 2021 17:21:40) ( NTS )
Copyright (c) 1997-2018 The PHP Group
Zend Engine v3.3.20, Copyright (c) 1998-2018 Zend Technologies
    with Zend OPcache v7.3.20, Copyright (c) 1999-2018, by Zend Technologies


[root@Centos7 ~]# /php/php73/bin/pecl -V
PEAR Version: 1.10.12
PHP Version: 7.3.20
Zend Engine Version: 3.3.20
Running on: Linux Centos7 3.10.0-1160.11.1.el7.x86_64 #1 SMP Fri Dec 18 16:34:56 UTC 2020 x86_64


[root@Centos7 ~]# cat /etc/redhat-release
CentOS Linux release 7.9.2009 (Core)
2.2 安装 xhprof 扩展
- pecl 安装
xhprof- 如果是针对 PHP5.x 的,需要安装
xhprof-0.9.4版本 - 如果是针对 PHP7.0 以上,则直接安装
xhprof也就是最新版
- 如果是针对 PHP5.x 的,需要安装
[root@Centos7 ~]# /php/php73/bin/pecl install xhprof

....
Build process completed successfully
Installing '/php/php7.3.20/lib/php/extensions/no-debug-non-zts-20180731/xhprof.so'
install ok: channel://pecl.php.net/xhprof-2.3.9
configuration option "php_ini" is not set to php.ini location
You should add "extension=xhprof.so" to php.ini- 配置
php.ini增加xhprof配置xhprof.output_dir
# 创建目录
[root@Centos7 ~]# mkdir -p /tmp/php-xhprof/output


# 追加配置
[root@Centos7 ~]# vim  /php/php7.3.20/lib/php.ini
[xhprof]
extension=xhprof.so
xhprof.output_dir=/tmp/php-xhprof/output


# 重启
[root@Centos7 ~]# /etc/init.d/php-fpm73 restart
Gracefully shutting down php-fpm . done
Starting php-fpm done- 检查
xhprof是否被加载
[root@Centos7 ~]# php73 -m | grep xhprof
xhprof
[root@Centos7 ~]# php --ri
xhprof

xhprof support => enabled
Version => 2.3.9

Directive => Local Value => Master Value
xhprof.output_dir => /tmp/php-xhprof/output => /tmp/php-xhprof/output
xhprof.collect_additional_info => 0 => 0
xhprof.sampling_interval => 100000 => 100000
xhprof.sampling_depth => 2147483647 => 2147483647
2.3 其他准备
# 为防止需要图片相关依赖
[root@Centos7 ~]# yum install libpng -y
[root@Centos7 ~]# yum install graphviz -y


# 为性能数据采集准备
[root@Centos7 php-xhprof]# php -m | grep -E "mongodb|xhprof"
mongodb
xhprof
3、Ues Profiler
3.1 xhprof 相关函数说明
- xhprof_enable(int $flags = 0, array $options = ?): void
- $flags 配置
XHPROF_FLAGS_NO_BUILTINS跳过所有内置函数XHPROF_FLAGS_CPU输出的性能数据中添加 CPU 数据XHPROF_FLAGS_MEMORY输出的性能数据中添加内存数据
- $options
- 忽略性能分析中的某些函数
- $flags 配置
- xhprof_disable(): array
- 返回值就是本次采集的 xhprof_data 数据
3.2 在 CLI 中使用 xhprof 进行性能分析
3.2.1 引入 longxinH/xhprof 一些类库
- 创建一个项目目录
/code/php-xhprof - 拉取
longxinH/xhprof代码 - 创建一个测试目录
/code/php-xhprof/testcli - 复制
longxinH/xhprof代码目录中的xhprof_htmlxhprof_lib代码目录到testcli
[root@Centos7 ~]# mkdir -p /code/php-xhprof
[root@Centos7 ~]# mkdir -p /code/php-xhprof/testcli
[root@Centos7 ~]# cd /code/php-xhprof
[root@Centos7 php-xhprof]# git clone https://github.com/longxinH/xhprof


[root@Centos7 php-xhprof]# cd /code/php-xhprof/testcli
[root@Centos7 testcli]# cp -R  /code/php-xhprof/xhprof/xhprof_*  /code/php-xhprof/
3.2.2 在 testcli 目录下创建测试脚本 test.php
[root@Centos7 testcli]# touch /code/php-xhprof/testcli/test.php


[root@Centos7 php-xhprof]# tree -L 2
.
├── testcli
│   ├── inject.php
│   └── test.php
├── xhprof
│   ├── bin
│   ├── CHANGELOG
│   ├── CREDITS
│   ├── examples
│   ├── extension
│   ├── LICENSE
│   ├── package.xml
│   ├── README.md
│   ├── resource
│   ├── scripts
│   ├── support
│   ├── travis
│   ├── xhprof_html
│   └── xhprof_lib
├── xhprof_html
│   ├── callgraph.php
│   ├── css
│   ├── docs
│   ├── index.php
│   ├── jquery
│   ├── js
│   └── typeahead.php
└── xhprof_lib
    ├── display
    └── utils
3.2.3 编写测试脚本 test.php
<?php


// 开启 xhprof
xhprof_enable(XHPROF_FLAGS_NO_BUILTINS + XHPROF_FLAGS_CPU + XHPROF_FLAGS_MEMORY);


function test($i) {
    if($i == 0) {
        return 1;
    } else {
        return $i * test($i - 1);
    }
};


$res = test(3);
var_dump($res); // 函数执行结果


// 结束 xhprof
$xhprof_data = xhprof_disable();
var_dump($xhprof_data); // xhprof 收集到的数据


// 下面与 xhprof 扩展无关,而是 PHP 序列化 xhprof_data 的数据,并生成一个文件
// 将收集到的数据 序列化存储到 xhprof.output_dir 目录中,生成一个唯一的文件,返回 文件 run_id
$XHPROF_ROOT = realpath(dirname(__FILE__) . '/..');
include_once $XHPROF_ROOT . "/xhprof_lib/utils/xhprof_lib.php";
include_once $XHPROF_ROOT . "/xhprof_lib/utils/xhprof_runs.php";
$xhprof_runs = new XHProfRuns_Default();
$run_id = $xhprof_runs->save_run($xhprof_data, "xhprof_testcli");
var_dump($run_id);
3.2.4 执行测试脚本 test.php
[root@Centos7 php]# php test.php
int(6)
array(5) {
  ["test@2==>test@3"]=>
  array(5) {
    ["ct"]=>
    int(1)
    ["wt"]=>
    int(2)
    ["cpu"]=>
    int(11)
    ["mu"]=>
    int(832)
    ["pmu"]=>
    int(0)
  }
  ["test@1==>test@2"]=>
  array(5) {
    ["ct"]=>
    int(1)
    ["wt"]=>
    int(13)
    ["cpu"]=>
    int(13)
    ["mu"]=>
    int(1408)
    ["pmu"]=>
    int(0)
  }
  ["test==>test@1"]=>
  array(5) {
    ["ct"]=>
    int(1)
    ["wt"]=>
    int(16)
    ["cpu"]=>
    int(16)
    ["mu"]=>
    int(1984)
    ["pmu"]=>
    int(0)
  }
  ["main()==>test"]=>
  array(5) {
    ["ct"]=>
    int(1)
    ["wt"]=>
    int(26)
    ["cpu"]=>
    int(27)
    ["mu"]=>
    int(2560)
    ["pmu"]=>
    int(0)
  }
  ["main()"]=>
  array(5) {
    ["ct"]=>
    int(1)
    ["wt"]=>
    int(69)
    ["cpu"]=>
    int(67)
    ["mu"]=>
    int(3160)
    ["pmu"]=>
    int(0)
  }
}
string(13) "646329afc4f30"
3.2.5 查看 xhprof 收集的数据文件
[root@Centos7 php]# cat /tmp/php-xhprof/output/646329afc4f30.xhprof_testcli.xhprof
a:5:{s:15:"test@2==>test@3";a:5:{s:2:"ct";i:1;s:2:"wt";i:2;s:3:"cpu";i:11;s:2:"mu";i:832;s:3:"pmu";i:0;}s:15:"test@1==>test@2";a:5:{s:2:"ct";i:1;s:2:"wt";i:13;s:3:"cpu";i:13;s:2:"mu";i:1408;s:3:"pmu";i:0;}s:13:"test==>test@1";a:5:{s:2:"ct";i:1;s:2:"wt";i:16;s:3:"cpu";i:16;s:2:"mu";i:1984;s:3:"pmu";i:0;}s:13:"main()==>test";a:5:{s:2:"ct";i:1;s:2:"wt";i:26;s:3:"cpu";i:27;s:2:"mu";i:2560;s:3:"pmu";i:0;}s:6:"main()";a:5:{s:2:"ct";i:1;s:2:"wt";i:69;s:3:"cpu";i:67;s:2:"mu";i:3160;s:3:"pmu";i:0;}}
3.2.6 xhprof_data 数据涵义
| 字段 | 涵义 |
|---|---|
| ct | 函数被调用的次数 |
| wt | 函数的执行时间耗时 |
| cpu | 函数消耗的CPU时间 |
| mu | 函数方法使用的内存 |
| pmu | 函数方法使用的峰值内存 |
3.2.6 查看 xhprof 可视化报告分析
只有数据没有图看起来很费劲,别忘记了,它有自带的可视化配置 HTML
Nginx 配置 WEB UI ,然后重启 Nginx, 可以访问
xhprof.tacks.com
server {
    listen  80;
    server_name xhprof.tacks.com;
    # 配置 xhprof HTML 根目录
    root /code/php-xhprof/xhprof_html/;
    index index.html index.php;
    access_log /logs/tacks/xhprof.tacks.com-access.log;
    error_log /logs/tacks/xhprof.tacks.com-error.log;
    rewrite_log on;

    location / {
            try_files $uri $uri/ /index.php?$query_string;
    }

    location ~ \.php$ {
        fastcgi_pass 127.0.0.1:9000;
        fastcgi_index index.php;
        fastcgi_param SCRIPT_FILENAME $document_root$fastcgi_script_name;
        fastcgi_param SERVER_SOFTWARE nginx;
        include fastcgi_params;
    }
}- 针对本例,应该访问
http://xhprof.tacks.com/index.php?run=646329afc4f30&source=xhprof_testcli
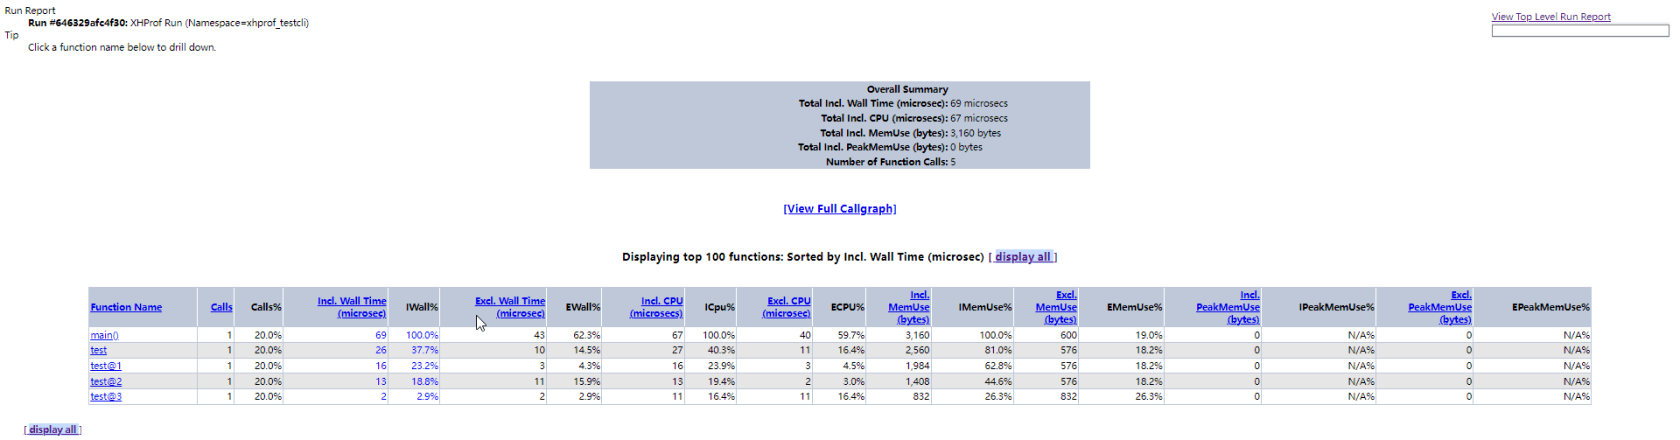
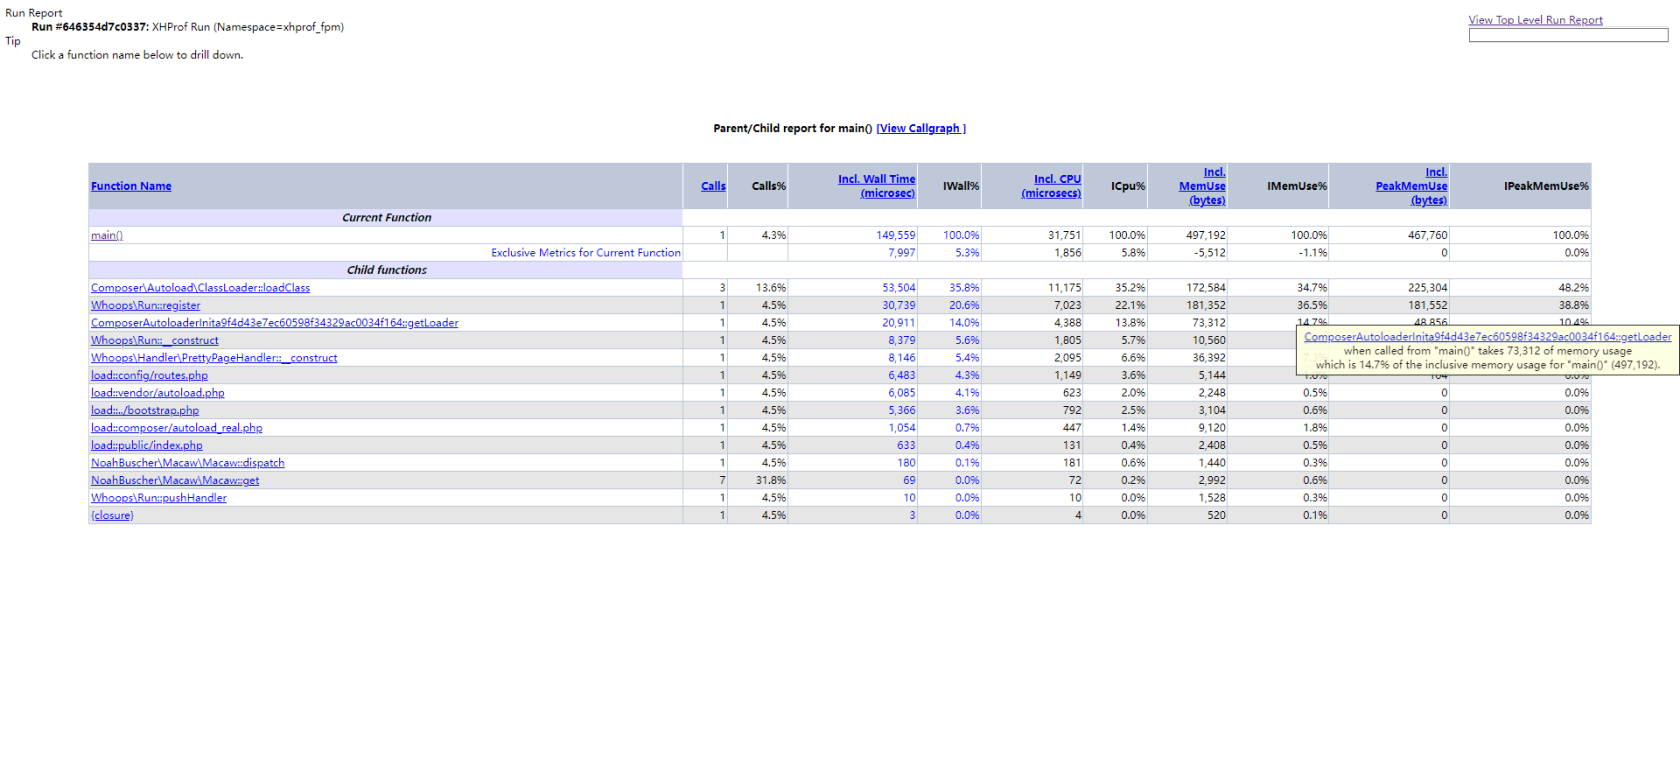
| 字段 | 涵义 |
|---|---|
| Function Name | 函数名 |
| Calls | 调用次数 |
| Incl. Wall Time (microsec) | 函数运行时间(包括子函数) |
| IWall% | 函数运行时间(包括子函数)占比 |
| Excl. Wall Time (microsec) | 函数运行时间(不包括子函数) |
| EWall% | 函数运行时间(不包括子函数)占比 |
| [View Full Callgraph] | 函数调用链图 (需要graphviz) |
- 具体展示图表可以看本文 4.1 章节
3.2.7 分析所有 PHP 脚本文件
- 编写
xhprof通用采集脚本inject.php
<?php
# /code/php-xhprof/testcli/inject.php
$XHPROF_ROOT = realpath(dirname(__FILE__) . '/..');
include_once $XHPROF_ROOT . "/xhprof_lib/utils/xhprof_lib.php";
include_once $XHPROF_ROOT . "/xhprof_lib/utils/xhprof_runs.php";

xhprof_enable(XHPROF_FLAGS_NO_BUILTINS + XHPROF_FLAGS_CPU + XHPROF_FLAGS_MEMORY);

// 注册一个函数,当程序执行结束的时候去执行它。
register_shutdown_function(function () {
    // stop profiler
    $xhprof_data = xhprof_disable();

    // 冲刷
    if (function_exists('fastcgi_finish_request')) {
        fastcgi_finish_request();
    }

    // 生成文件
    $xhprof_runs = new XHProfRuns_Default();
    $xhprof_runs->save_run($xhprof_data, "xhprof_testcli_inject");
});- 在执行任意 PHP 脚本前,进行注入采集脚本,修改
php.ini配置,设置auto_prepend_file,然后重启 php
这样所有的 PHP 脚本文件执行都会自动注入 inject.php 采集文件,非常方便,无需入侵真正的 PHP 业务代码;
[root@Centos7 php-xhprof]# vim /php/php73/lib/php.ini
; Automatically add files before PHP document.
; http://php.net/auto-prepend-file
; auto_prepend_file =
auto_prepend_file=/code/php-xhprof/testcli/inject.php
3.3 在 PHP-FPM 中使用 xhprof 进行性能分析
3.3.1 分析特定域名的 WEB 请求
还是利用之前的 xhprof 通用采集脚本 inject.php ,可以创建一个新的 /code/php-xhprof/testfpm/inject.php
- 针对某个站点 利用
fastcgi_param指令设置auto_prepend_file- 问题:由于
php-fpm进程可能会复用,也就是多个网站用到同一个php-fpmworker进程来处理,这种情况就有可能收集到其他网站的请求 - 解决:可以通过入侵方式,将代码写入到网站的入口文件,来进行收集数据;
- 问题:由于
# 追加 配置
# fastcgi_param PHP_VALUE "auto_prepend_file=/code/php-xhprof/testfpm/inject.php";

    location ~ \.php$ {
        fastcgi_pass 127.0.0.1:9000;
        fastcgi_index index.php;
        fastcgi_param SCRIPT_FILENAME $document_root$fastcgi_script_name;
        fastcgi_param SERVER_SOFTWARE nginx;
        fastcgi_param PHP_VALUE "auto_prepend_file=/code/php-xhprof/testfpm/inject.php";
        include fastcgi.conf;
    }
4、Web-UI
4.1 使用 xhprof 自带页面进行性能数据的可视化
4.1.1 xhprof Web UI 基本使用
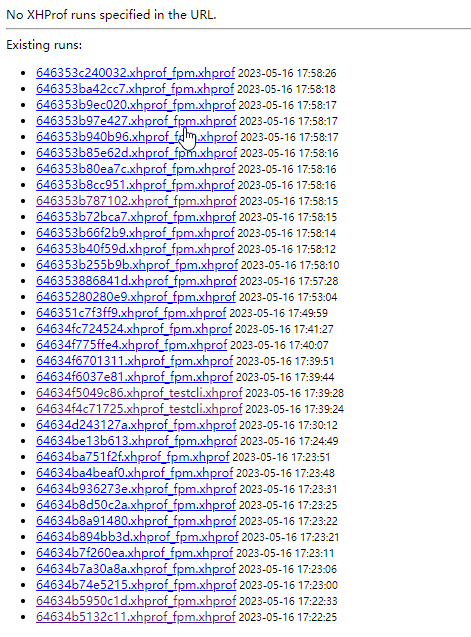
可以看到采集的各种请求
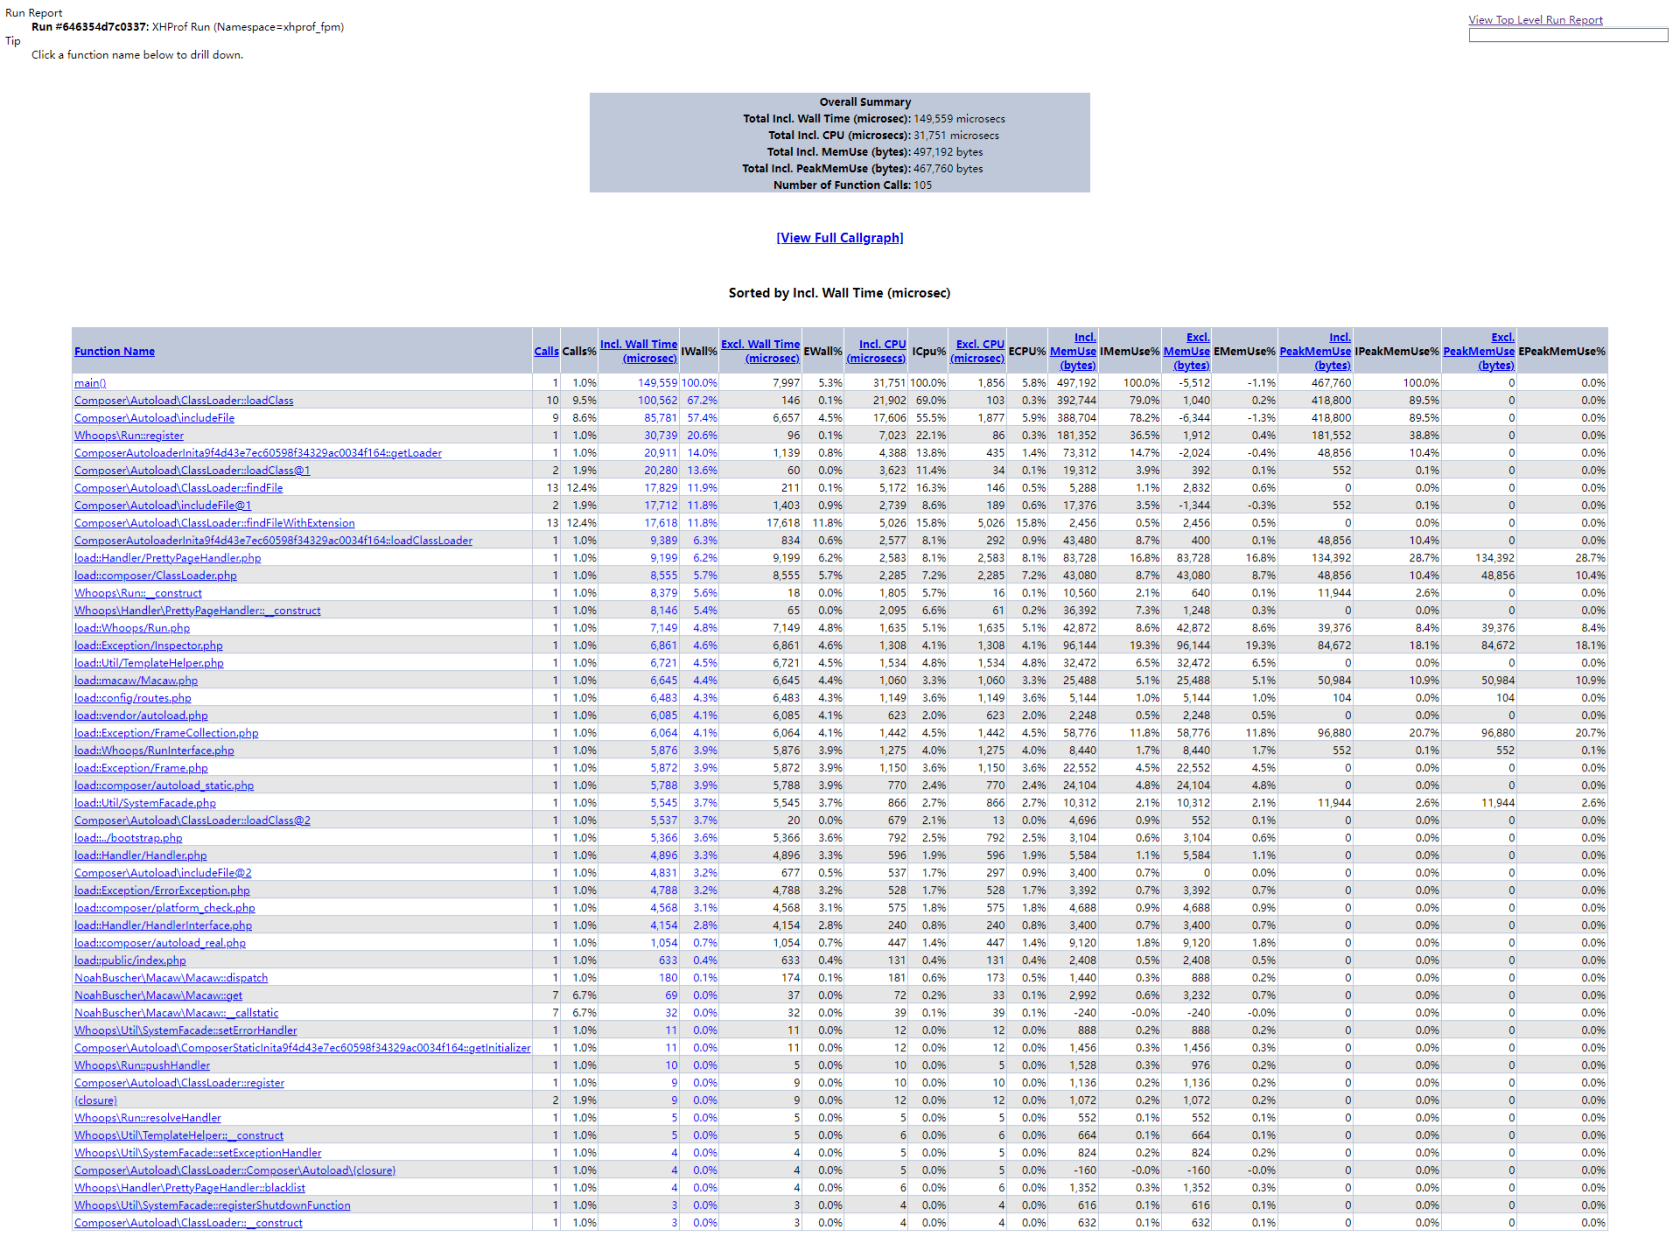
- 点击某个
Function Name查看 父子函数的数据对比- 可以进入查看 父函数(Current Function) 和 子函数(Child functions) 的数据采集
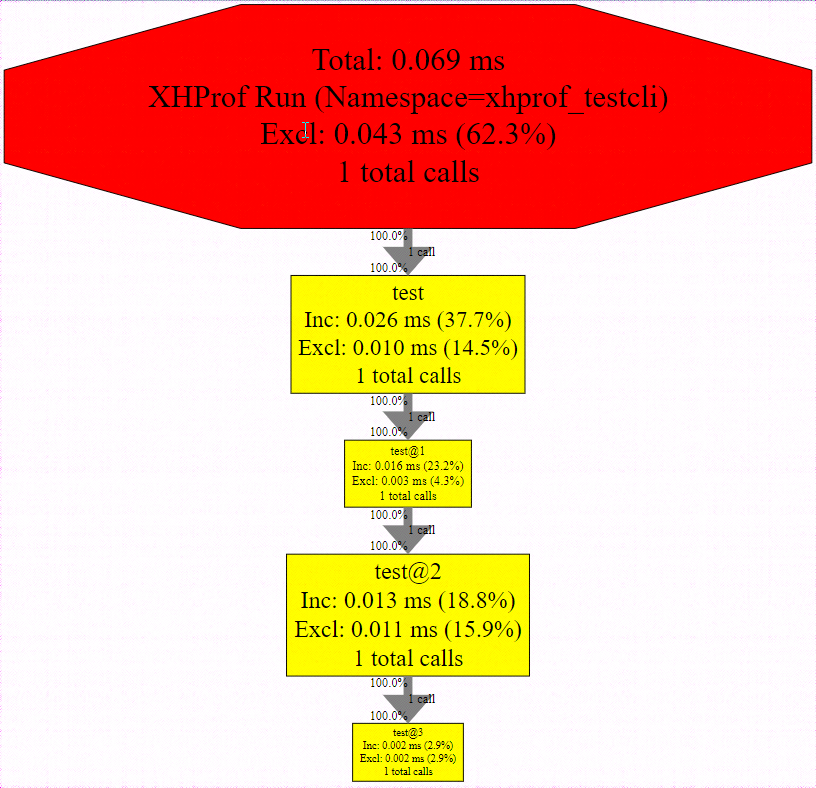
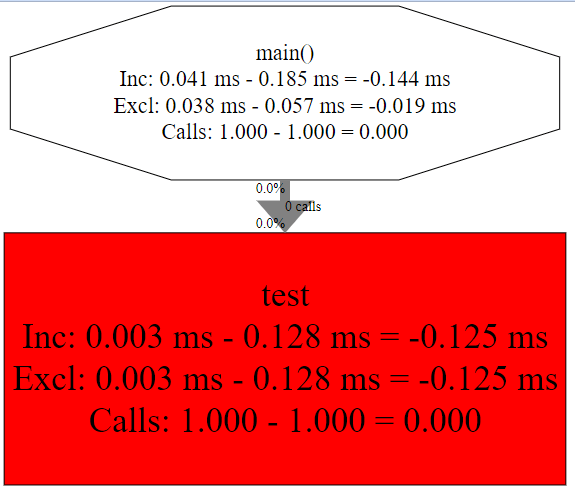
- 点击
View Callgraph- 可以进入查看 函数的调用链,并且根据颜色可以看到哪个函数耗时最大
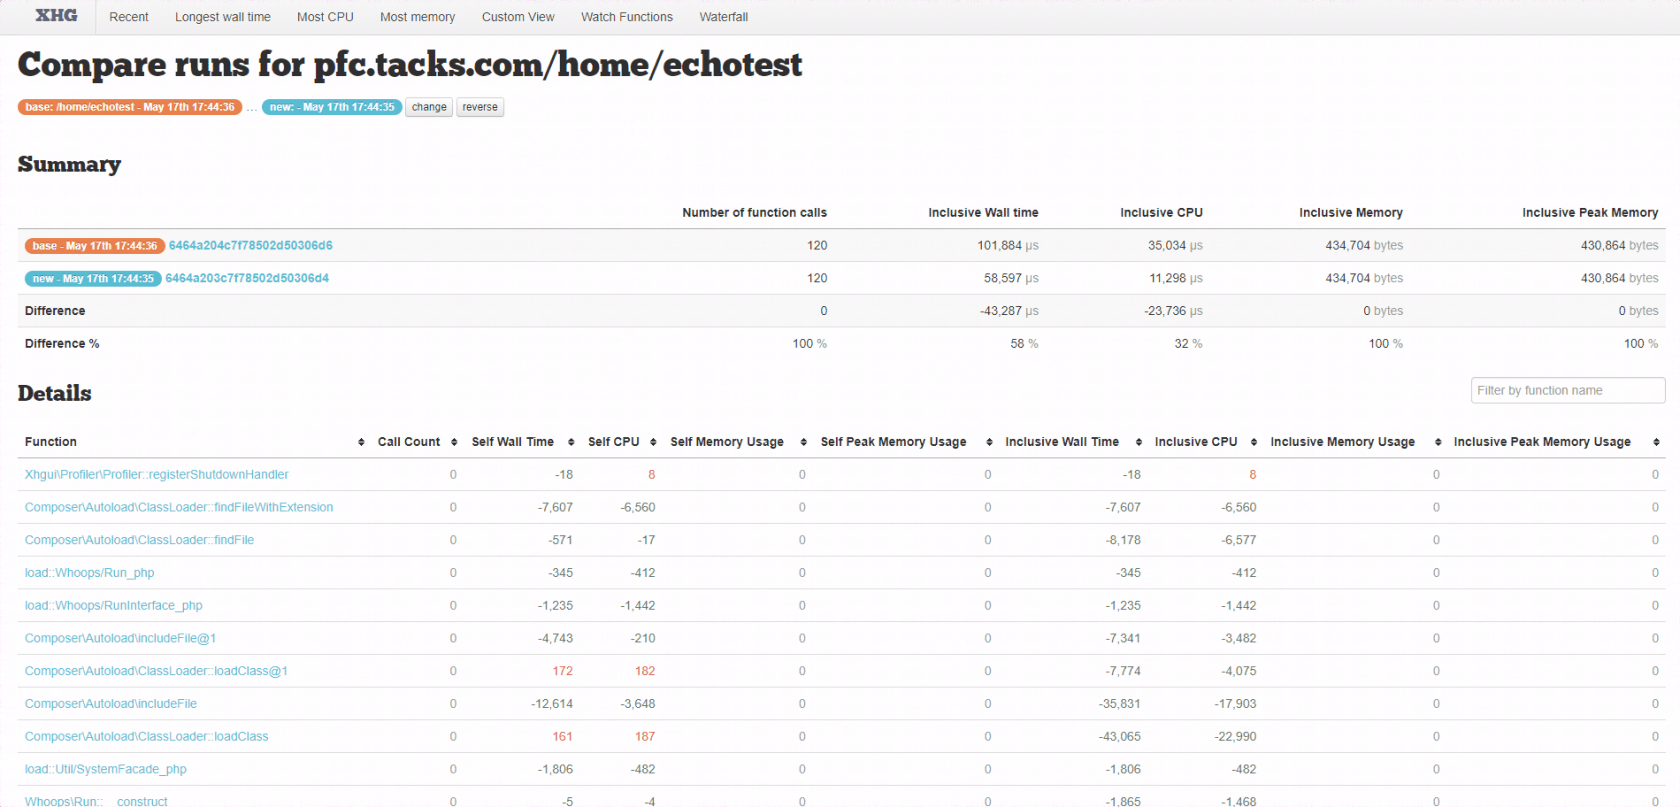
4.1.2 使用 Diff Report 对比两次请求采集的数据
TIPS 使用参数 run1 run2 分别指向两次请求的 run_id ,另外可以点击页面的 Invert Diff Report 来反转两次请求的 run_id
- 请求 A
function test() {
    $result = 0;
    for ($i=1; $i <= 10000; $i++) {
        $result += $i;
    }
    return $result;
}- 请求 B
function test() {
    return 10000 * (1+10000) / 2;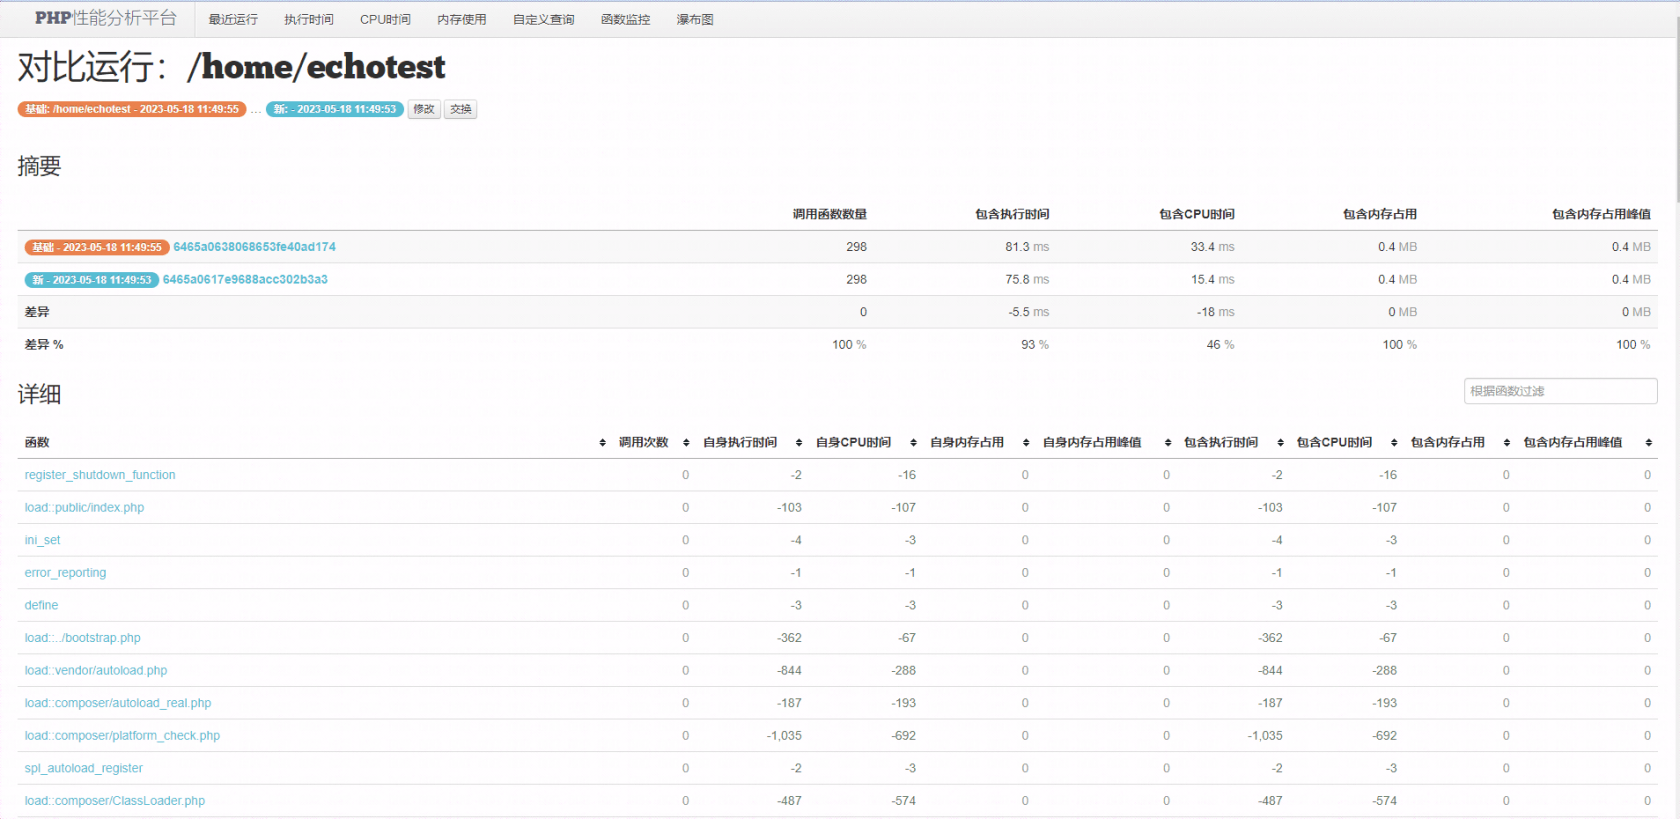
}请求B 相比 请求A 可以看到 CPU 和 内存 都大幅度降低;
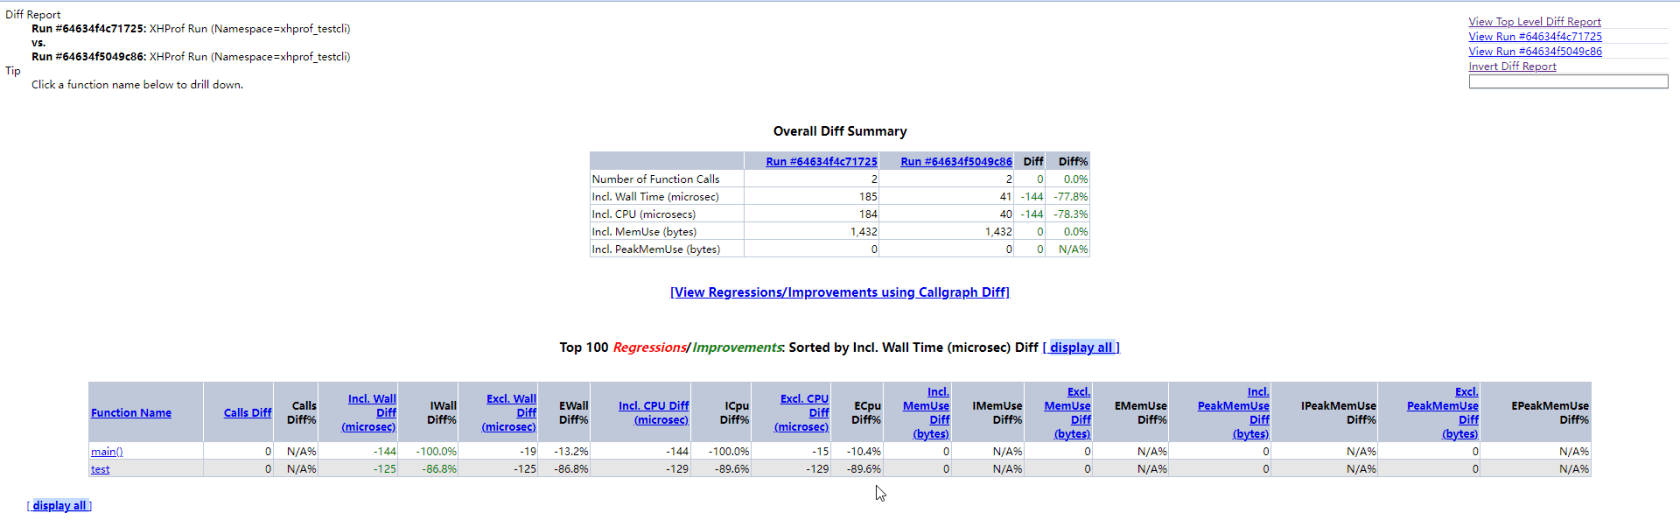
可以看到函数调用耗时之差,以及调用次数之差
4.1.3 查看汇总请求
TIPS 使用参数 run=XXX,YYY,ZZZ 可以汇总多次请求
4.2 使用第三方工具进行性能数据的可视化
4.2.1 perftools/php-profiler 和 perftools/xhgui 的组合拳,瞬间搭建专属的性能分析平台
前情提要
- 性能分析利器
xhprof- PHP 安装此扩展
- 通用采集分析器
profilerperftools/php-profiler- 支持多种性能分析的扩展;类似一个通用的黑盒,使用此组件,然后选择响应的 性能采集扩展即可
xhprof对应的就是 类perftools/php-profiler/src/Profilers/XHProf.php- 支持采集数据的持久化;
- 性能可视化分析UI
xhguiperftools/xhgui- 将数据持久化到
mongodb
整体流程就是 project => php-profiler => xhprof => xhgui
快速起一个 WEB 项目
可以找任意框架,或者你当前的项目,这里只是为了演示,用了这个仓库 PFC 。
[root@Centos7 php-xhprof]# pwd
/code/php-xhprof
# 克隆项目
[root@Centos7 php-xhprof]# git clone https://github.com/Tacks9/php-framework-by-composer pfc
[root@Centos7 php-xhprof]# ls pfc/
app  bootstrap.php  composer.json  composer.lock  composer.phar  config  data  public  readme.md  services  vendor

# 配置 Nginx
[root@Centos7 php-xhprof]# vim /etc/nginx/conf/pfc.conf
server
{
    listen 80;
    server_name pfc.tacks.com;

    index index.html index.htm index.php index.shtml index.shtm;
    root /code/php-xhprof/pfc/public;

    access_log /logs/tacks/pfc.tacks.com-access.log;
    error_log /logs/tacks/pfc.tacks.com-error.log;

    location / {
        try_files $uri $uri/ /index.php?$args;
    }

    location ~ \.php$ {
        fastcgi_pass 127.0.0.1:9000;
        fastcgi_index index.php;
        fastcgi_param SCRIPT_FILENAME $document_root$fastcgi_script_name;
        fastcgi_param SERVER_SOFTWARE nginx;
        include fastcgi_params;
    }
}
# 重启 Nginx
[root@Centos7 php-xhprof]# systemctl restart nginx

# 设置 hosts
[root@Centos7 php-xhprof]# vim /etc/hosts
127.0.0.1 pfc.tacks.com

# 模拟请求
[root@Centos7 php-xhprof]# curl http://pfc.tacks.com/home/echotest
<h1> 控制器、方法  Home/echotest </h1>
在你的项目引入 perftools/php-profiler
[root@Centos7 pfc]# pwd
/code/php-xhprof/pfc
# composer 引入 perftools/php-profiler
[root@Centos7 pfc]# composer require perftools/php-profiler

# 增加 profiler.php 探测器启动文件
[root@Centos7 pfc]# touch config/profiler.php

# 项目入口文件引入 profiler.php
[root@Centos7 pfc]# vim bootstrap.php

# 在自动加载器后面
// 【探测器】
require BASE_PATH.'/config/profiler.php';- 探测器脚本
config/profiler.php- 配置 profiler 使用的扩展为
xhprof,因为本文主打就是xhprof,当然如果你如果安装类似其他的扩展如tideways_xhprof,可以自己尝试 - 配置数据存储方式
save.handler- 主打通过
SAVER_STACK的方式,可以将采集数据以多种方式存储 - 接口上传
save.handler.upload- 当然你可能会疑惑这个接口哪里来,当时看文档的时候愣是不知道哪里来的接口,这就需要组合拳的另一套
perftools/xhgui工具
- 当然你可能会疑惑这个接口哪里来,当时看文档的时候愣是不知道哪里来的接口,这就需要组合拳的另一套
- 文件存储
save.handler.file- 默认以 json 的方式存储到
/tmp/xhgui.data.jsonl下
- 默认以 json 的方式存储到
- 主打通过
- 配置 profiler 使用的扩展为
// /code/php-xhprof/pfc/config/profiler.php
<?php

/**
 * Bootstrap for php-profiler. Copy and customize this file,
 * include this file inside some bootstrapper or other "early central point in execution"
 *
 * Documentation:
 * - https://github.com/perftools/php-profiler#create-profiler
 * - https://github.com/perftools/php-profiler#config
 */

use Xhgui\Profiler\Profiler;
use Xhgui\Profiler\ProfilingFlags;

// require __DIR__ . '/../vendor/perftools/php-profiler/autoload.php';

try {
    $config = array(
        // 选择性能分析器 xhprof 扩展
        'profiler' => Profiler::PROFILER_XHPROF,
        // 配置要捕获的分析数据
        'profiler.flags' => array(
            ProfilingFlags::CPU,
            ProfilingFlags::MEMORY,
            ProfilingFlags::NO_BUILTINS,
            ProfilingFlags::NO_SPANS,
        ),
        // 采集数据的保存方式
        'save.handler' => Profiler::SAVER_STACK,

        // 存储数据的接口
        // https://github.com/perftools/php-profiler#upload-saver
        'save.handler.upload' => array(
            'url' => 'http://xhgui.tacks.com/run/import',
            // 接口超时时间
            'timeout' => 3,
            // XHGui 的  upload.token
            'token' => 'token',
        ),

        // 存储数据的文件
        // https://github.com/perftools/php-profiler#file-saver
        'save.handler.file' => array(
            'filename' => '/tmp/xhgui.data.jsonl',
        ),

        // 采用堆栈的方式存储采集数据
        // https://github.com/perftools/php-profiler#stack-saver
        'save.handler.stack' => array(
            'savers' => array(
                Profiler::SAVER_UPLOAD,
                Profiler::SAVER_FILE,
            ),
            // 如果设置 true 就是全部存储,如果false,就按照顺序不成功就用下一个保存方式
            'saveAll' => false,
        ),

        // 采用Mongodb存储采集数据(作者不推荐直接存储到这里)
        // https://github.com/perftools/php-profiler#mongodb-saver
        'save.handler.mongodb' => array(
            'dsn' => 'mongodb://127.0.0.1:27017',
            'database' => 'xhprof',
            // Allows you to pass additional options like replicaSet to MongoClient.
            // 'username', 'password' and 'db' (where the user is added)
            'options' => array(),
            // Allows you to pass driver options like ca_file to MongoClient
            'driverOptions' => array(),
        ),

        // Environment variables to exclude from profiling data
        'profiler.exclude-env' => array(),
        'profiler.options' => array(),

        // 探测器采集(可以保存一定比例的请求,而非全部)
        // Profile 1 in 100 requests.
        // You can return true to profile every request.
        'profiler.enable' => function () {
            if ($_SERVER['SERVER_NAME'] == 'pfc.tacks.com') {
                return true;
                // 100%采样,默认为1%
                return rand(1, 100) === 42;
            } else {
                return false;
            }
        },

        // 请求 URL 简化
        'profiler.simple_url' => function ($url) {
            return preg_replace('/=\d+/', '', $url);
        },

        // 请求 URL 替换,移除敏感信息,例如 token query
        'profiler.replace_url' => function ($url) {
            return str_replace('token', '', $url);
        },
    );

    // 加载配置
    $profiler = new Profiler($config);

    // 启动探测器
    $profiler->start();
} catch (Exception $e) {
    error_log($e->getMessage());
}
你的PHP需要mongodb支持
[root@Centos7 php-xhprof]# php --ri mongodb

mongodb

MongoDB support => enabled
MongoDB extension version => 1.15.2
MongoDB extension stability => stable
libbson bundled version => 1.23.3
libmongoc bundled version => 1.23.3
libmongoc SSL => enabled
libmongoc SSL library => OpenSSL
libmongoc crypto => enabled
libmongoc crypto library => libcrypto
libmongoc crypto system profile => disabled
libmongoc SASL => enabled
libmongoc ICU => disabled
libmongoc compression => enabled
libmongoc compression snappy => disabled
libmongoc compression zlib => enabled
libmongoc compression zstd => disabled
libmongocrypt bundled version => 1.5.2
libmongocrypt crypto => enabled
libmongocrypt crypto library => libcrypto
crypt_shared library version => unknown

Directive => Local Value => Master Value
mongodb.debug => no value => no value
采集数据持久化需要一个 mongodb
[root@Centos7 php-xhprof]# ps -ef | grep mongo | grep -v "grep"
root      6666     1  1 May11 ?        01:30:17 /usr/bin/mongod --dbpath=/mongodb/data -f /etc/mongod.conf
[root@Centos7 php-xhprof]# netstat -ntlp | grep mongod
tcp        0      0 0.0.0.0:27017           0.0.0.0:*               LISTEN      6666/mongod
启动一个 perftools/xhgui
[root@Centos7 php-xhprof]# pwd
/code/php-xhprof
# 克隆项目
[root@Centos7 php-xhprof]# git clone https://github.com/perftools/xhgui

# 配置 Nginx
[root@Centos7 php-xhprof]# vim /etc/nginx/conf/xhgui.conf
server
{
    listen 80;
    server_name xhgui.tacks.com;

    index index.html index.htm index.php index.shtml index.shtm;
    root /code/php-xhprof/xhgui/webroot;

    access_log /logs/tacks/xhgui.tacks.com-access.log;
    error_log /logs/tacks/xhgui.tacks.com-error.log;

    location / {
        try_files $uri $uri/ /index.php?$args;
    }

    location ~ \.php$ {
        fastcgi_pass 127.0.0.1:9000;
        fastcgi_index index.php;
        fastcgi_param SCRIPT_FILENAME $document_root$fastcgi_script_name;
        fastcgi_param SERVER_SOFTWARE nginx;
        include fastcgi_params;
    }
}
# 重启 Nginx
[root@Centos7 php-xhprof]# systemctl restart nginx
- 浏览器访问 xhgui.tacks.com/
- 访问 xhgui.tacks.com/run/import
- 你会发现 Method not allowed ,这个就是我们在
php-profiler中填写的配置save.handler.upload,用来上传数据
- 你会发现 Method not allowed ,这个就是我们在
大功告成,可以请求你的网站,然后使用性能分析xhgui工具
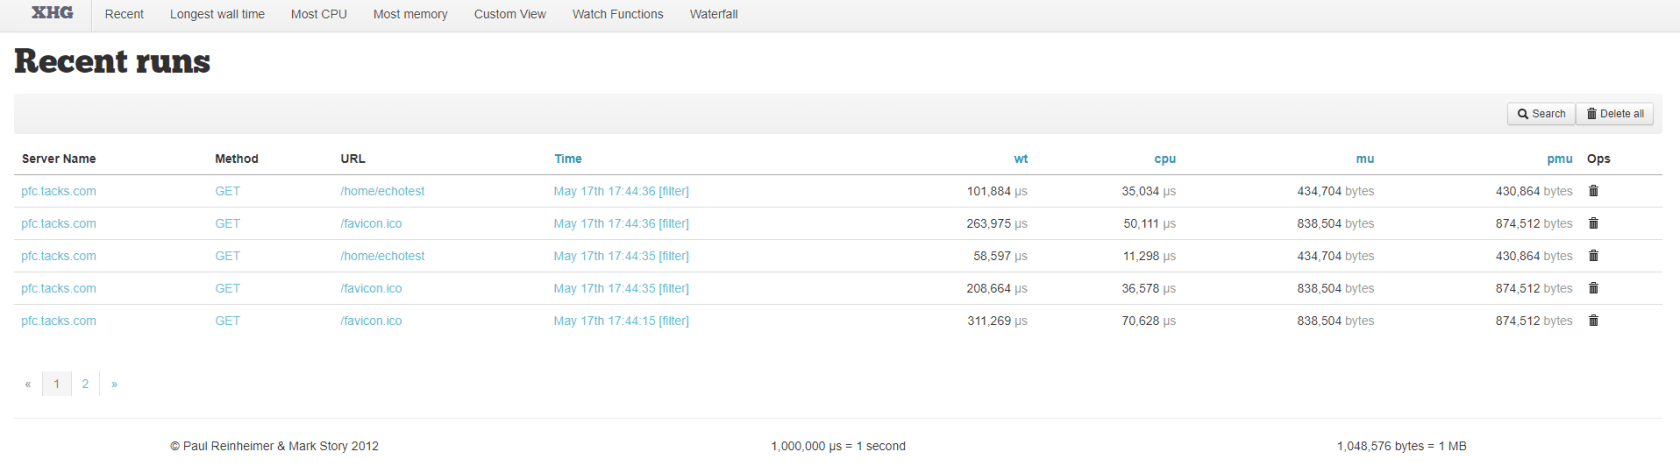
- 点击 Method 列,例如 某一行的 GET
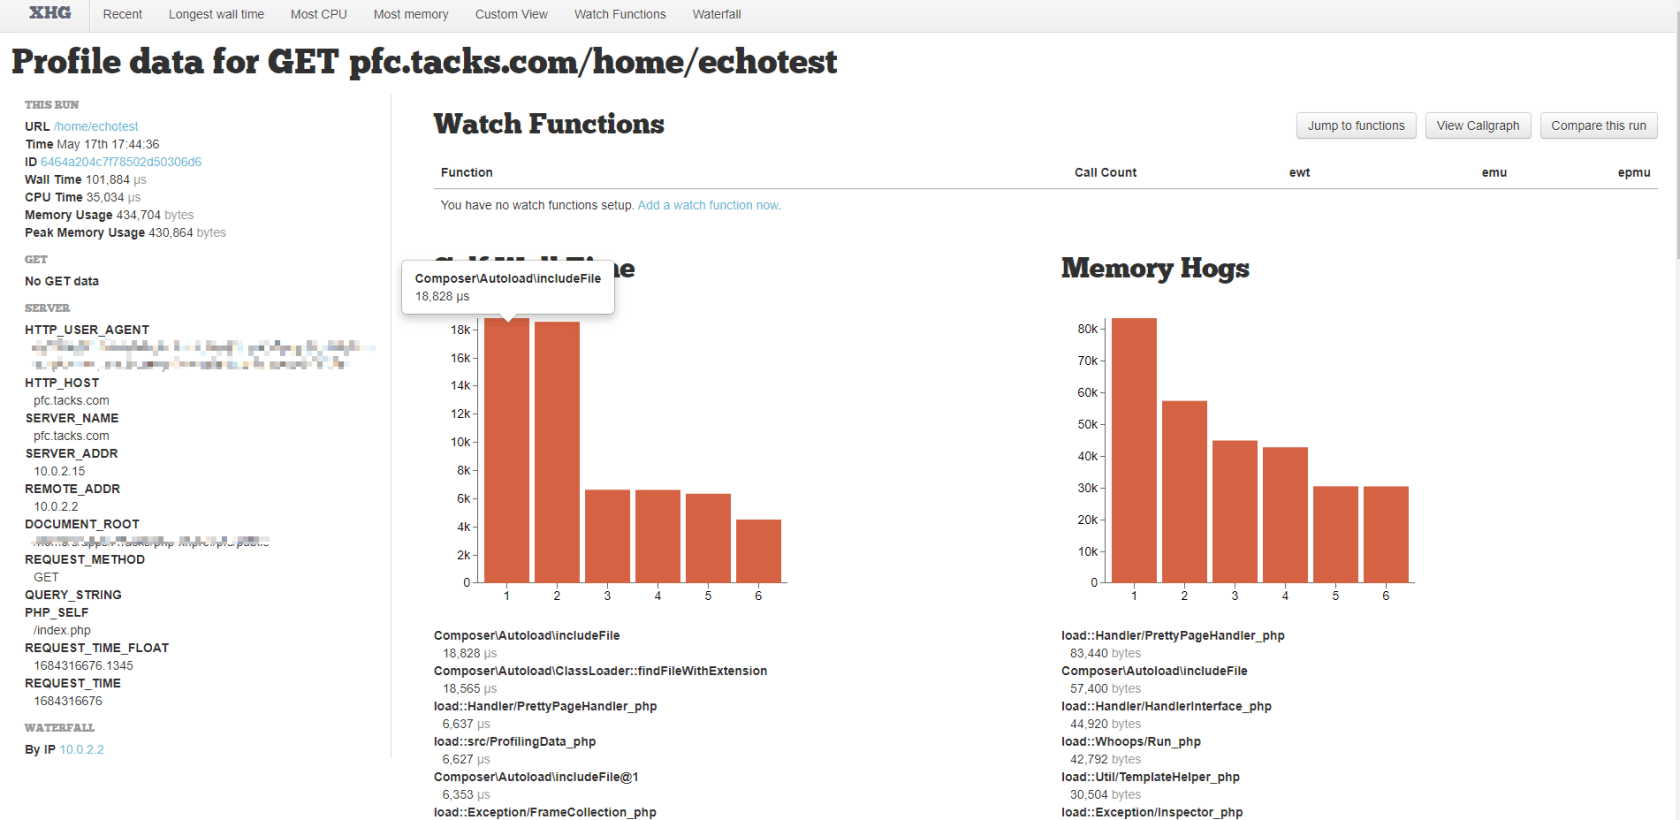
- 点击 Jump to Functions

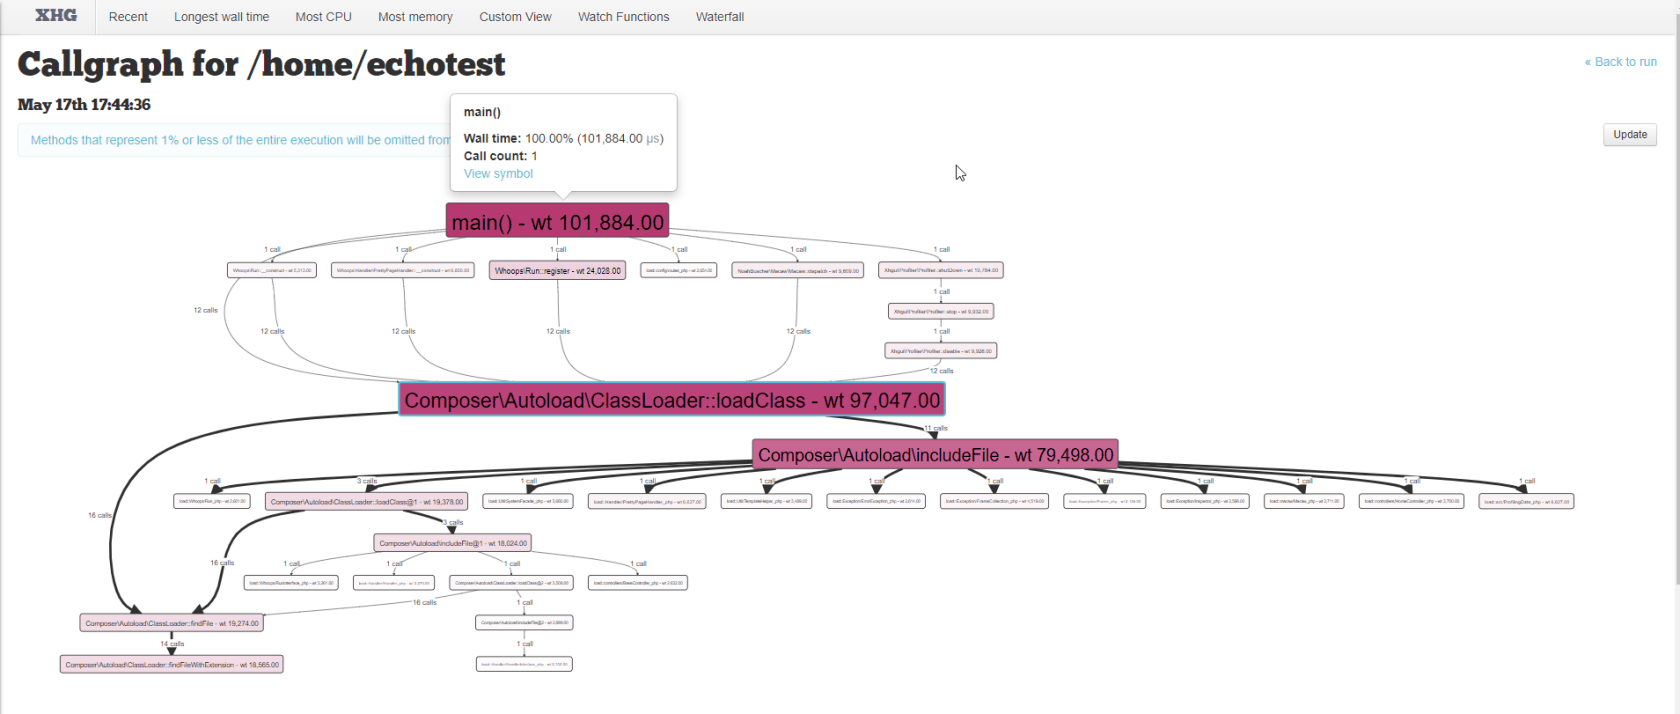
- 点击 View Callgraph,查看本次请求的方法调用图
- 点击 Compare this run,对比两次请求
- …
4.2.2 xhgui 的汉化版 laynefyc/xhgui-branch ,更贴合国人使用习惯
- xhgui-chinese
- 更多说明,请看
Readme
- 更多说明,请看
前情提要
- 性能分析利器
xhprof- PHP 安装此扩展
- 通用采集分析器
xhgui-chinese- 支持采集数据的持久化,默认存储
mongodb
- 支持采集数据的持久化,默认存储
- 性能可视化分析UI
xhgui-chinese的webroot- 将数据可视化展示,并且进行汉化,看起来直观一些
整体流程就是 project => xhgui-chinese => mongodb => webroot
快速起一个 WEB 项目
可以找任意框架,或者你当前的项目,这里只是为了演示,依然用了这个仓库 PFC 。
- 初始化一个新的 WEB 项目即可,比如访问的
pfc.tacks.com,剩下的就不演示了。
[root@Centos7 php-xhprof]# git clone https://github.com/Tacks9/php-framework-by-composer pfc
[root@Centos7 pfc]# pwd
/code/php-xhprof/pfc
[root@Centos7 pfc]# ls
app  bootstrap.php  composer.json  composer.lock  composer.phar  config  data  public  readme.md  services  vendor
部署 xhgui 汉化版
# 克隆项目
[root@Centos7 php-xhprof]# git clone https://github.com/laynefyc/xhgui-branch xhgui-chinese
[root@Centos7 xhgui-chinese]# pwd
/code/php-xhprof/xhgui-chinese
# composer 安装依赖
[root@Centos7 xhgui-chinese]# composer install
# 设置缓存目录
[root@Centos7 xhgui-chinese]# chmod -R 777 cache

[root@Centos7 xhgui-chinese]# ls
cache  CODE_OF_CONDUCT.md  composer.json  composer.lock  config  _config.yml  external  install.php  LICENSE  phpunit.xml  README.md  src  tests  vendor  webroot


# 配置 Nginx
[root@Centos7 xhgui-chinese]# vim /etc/nginx/conf/xhgui-chinese.conf
server
{
    listen 80;
    server_name xhgui-chinese.tacks.com;

    index index.html index.htm index.php index.shtml index.shtm;
    root /code/php-xhprof/xhgui-chinese/webroot;

    access_log /logs/tacks/xhgui-chinese.tacks.com-access.log;
    error_log /logs/tacks/xhgui-chinese.tacks.com-error.log;

    location / {
        try_files $uri $uri/ /index.php?$args;
    }

    location ~ \.php$ {
        fastcgi_pass 127.0.0.1:9000;
        fastcgi_index index.php;
        fastcgi_param SCRIPT_FILENAME $document_root$fastcgi_script_name;
        fastcgi_param SERVER_SOFTWARE nginx;
        include fastcgi_params;
    }
}
# 重启 Nginx
[root@Centos7 xhgui-chinese]# systemctl restart nginx- 浏览器访问 xhgui-chinese.tacks.com/
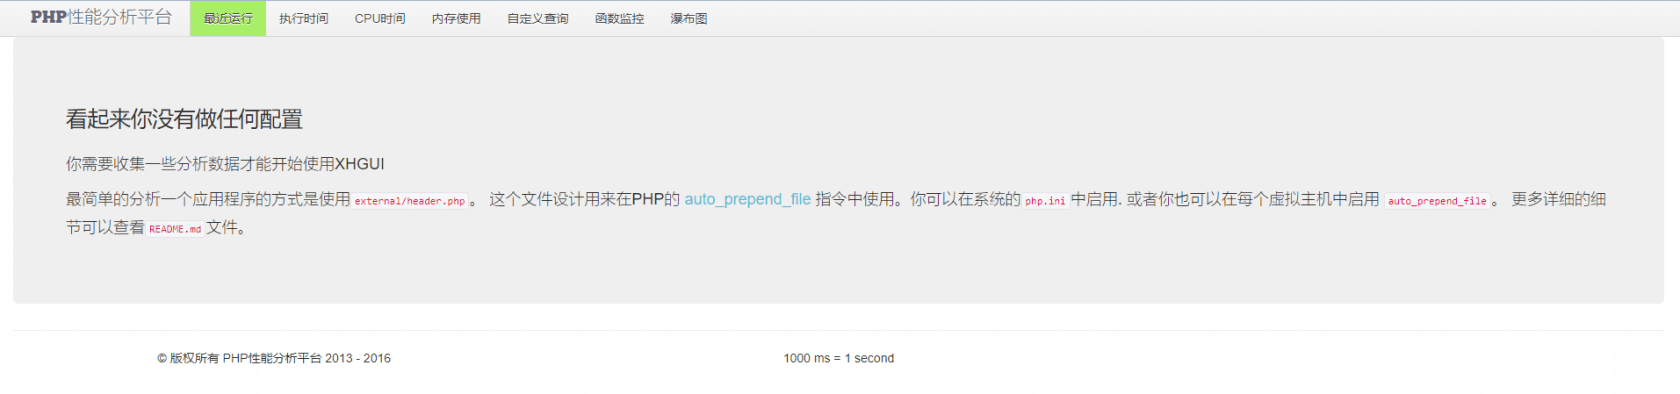
设置 xhgui 汉化版的配置文件
# 自定义配置
[root@Centos7 xhgui-chinese]# cp conf/config.default.php conf/config.php
[root@Centos7 xhgui-chinese]# vim conf/config.phpconf/config.php配置如下- 主要是对
profiler.enable进行设置,只接收来自设定的域名请求 extension扩展,依然采用xhprofsave.handler采集数据,使用mongodb,所以请先安装 php 的mongodb扩展db.host需要mongodb的服务端,可以本地启动一个,账号密码啥的可以在db.options设置在数组中- 数据库,默认采用
xhprof,当然可以重设一下,比如xhprof-xhgui-chinese
- 主要是对
<?php
return array(
    'debug' => false,
    'mode' => 'development',
    /*
     * support extension: uprofiler, tideways_xhprof, tideways, xhprof
     * default: xhprof
     */
    'extension' => 'xhprof',

    // Can be either mongodb or file.
    /*
    'save.handler' => 'file',
    'save.handler.filename' => dirname(__DIR__) . '/cache/' . 'xhgui.data.' . microtime(true) . '_' . substr(md5($url), 0, 6),
    */
    'save.handler' => 'mongodb',
    // Needed for file save handler. Beware of file locking. You can adujst this file path
    // to reduce locking problems (eg uniqid, time ...)
    //'save.handler.filename' => __DIR__.'/../data/xhgui_'.date('Ymd').'.dat',
    'db.host' => 'mongodb://127.0.0.1:27017',
    'db.db' => 'xhprof-xhgui-chinese',
    // Allows you to pass additional options like replicaSet to MongoClient.
    // 'username', 'password' and 'db' (where the user is added)
    'db.options' => array(),
    'templates.path' => dirname(__DIR__) . '/src/templates',
    'date.format' => 'Y-m-d H:i:s',
    'detail.count' => 6,
    'page.limit' => 25,
    // Profile 1 in 100 requests.
    // You can return true to profile every request.
    'profiler.enable' => function () {
        // return true;//rand(1, 100) === 42;
        if ($_SERVER['SERVER_NAME'] == 'pfc.tacks.com') {
            return true;
            // 100%采样,默认为1%
            return rand(1, 100) === 42;
        } else {
            return false;
        }
    },

    'profiler.simple_url' => function ($url) {
        return preg_replace('/\=\d+/', '', $url);
    },

    'profiler.filter_path' => array(
        //'/home/admin/www/xhgui/webroot','F:/phpPro'
    )

);
对 Mongodb 优化索引
这里用我本地测试的 mongodb 进行设置,如果你没有 mongodb 请先移步寻找如何安装。
至于 db 名字,看你在项目中如何配置的,如果为 xhprof-xhgui-chinese 就 use xhprof-xhgui-chinese ,默认的 db 名字为 xhprof
[root@Centos7 pfc]# mongo
MongoDB shell version v4.2.23
connecting to: mongodb://127.0.0.1:27017/?compressors=disabled&gssapiServiceName=mongodb
Implicit session: session { "id" : UUID("7b8bf1d3-507b-4c2f-aa18-c1c4615b515f") }
MongoDB server version: 4.2.23

> use xhprof-xhgui-chinese
> db.results.ensureIndex( { 'meta.SERVER.REQUEST_TIME' : -1 } )
> db.results.ensureIndex( { 'profile.main().wt' : -1 } )
> db.results.ensureIndex( { 'profile.main().mu' : -1 } )
> db.results.ensureIndex( { 'profile.main().cpu' : -1 } )
> db.results.ensureIndex( { 'meta.url' : 1 } )
设置 xhgui 需要监控的项目
header.php需要引入的文件
[root@Centos7 xhgui-chinese]# ls external/header.php
external/header.php
[root@Centos7 xhgui-chinese]# ls /code/php-xhprof/xhgui-chinese/external/header.php
/code/php-xhprof/xhgui-chinese/external/header.php Nginx配置,利用fastcgi_param设置auto_prepend_file
# 配置 Nginx
[root@Centos7 php-xhprof]# vim /etc/nginx/conf/pfc.conf
server
{
    listen 80;
    server_name pfc.tacks.com;

    index index.html index.htm index.php index.shtml index.shtm;
    root /code/php-xhprof/pfc/public;

    access_log /logs/tacks/pfc.tacks.com-access.log;
    error_log /logs/tacks/pfc.tacks.com-error.log;

    location / {
        try_files $uri $uri/ /index.php?$args;
    }

    location ~ \.php$ {
        fastcgi_pass 127.0.0.1:9000;
        fastcgi_index index.php;
        fastcgi_param SCRIPT_FILENAME $document_root$fastcgi_script_name;
        fastcgi_param SERVER_SOFTWARE nginx;
        fastcgi_param PHP_VALUE "auto_prepend_file=/code/php-xhprof/xhgui-chinese/external/header.php";
        include fastcgi_params;
    }
}
# 重启 Nginx
[root@Centos7 php-xhprof]# systemctl restart nginx大功告成,可以请求你的网站,然后使用性能分析xhgui-chinese工具
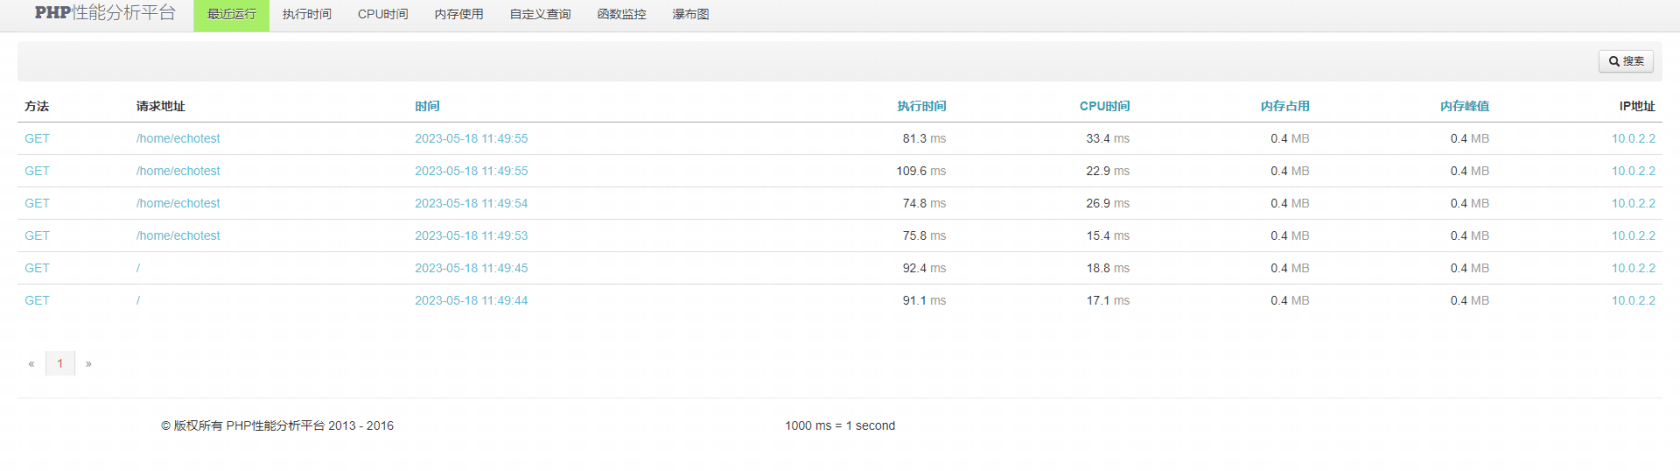
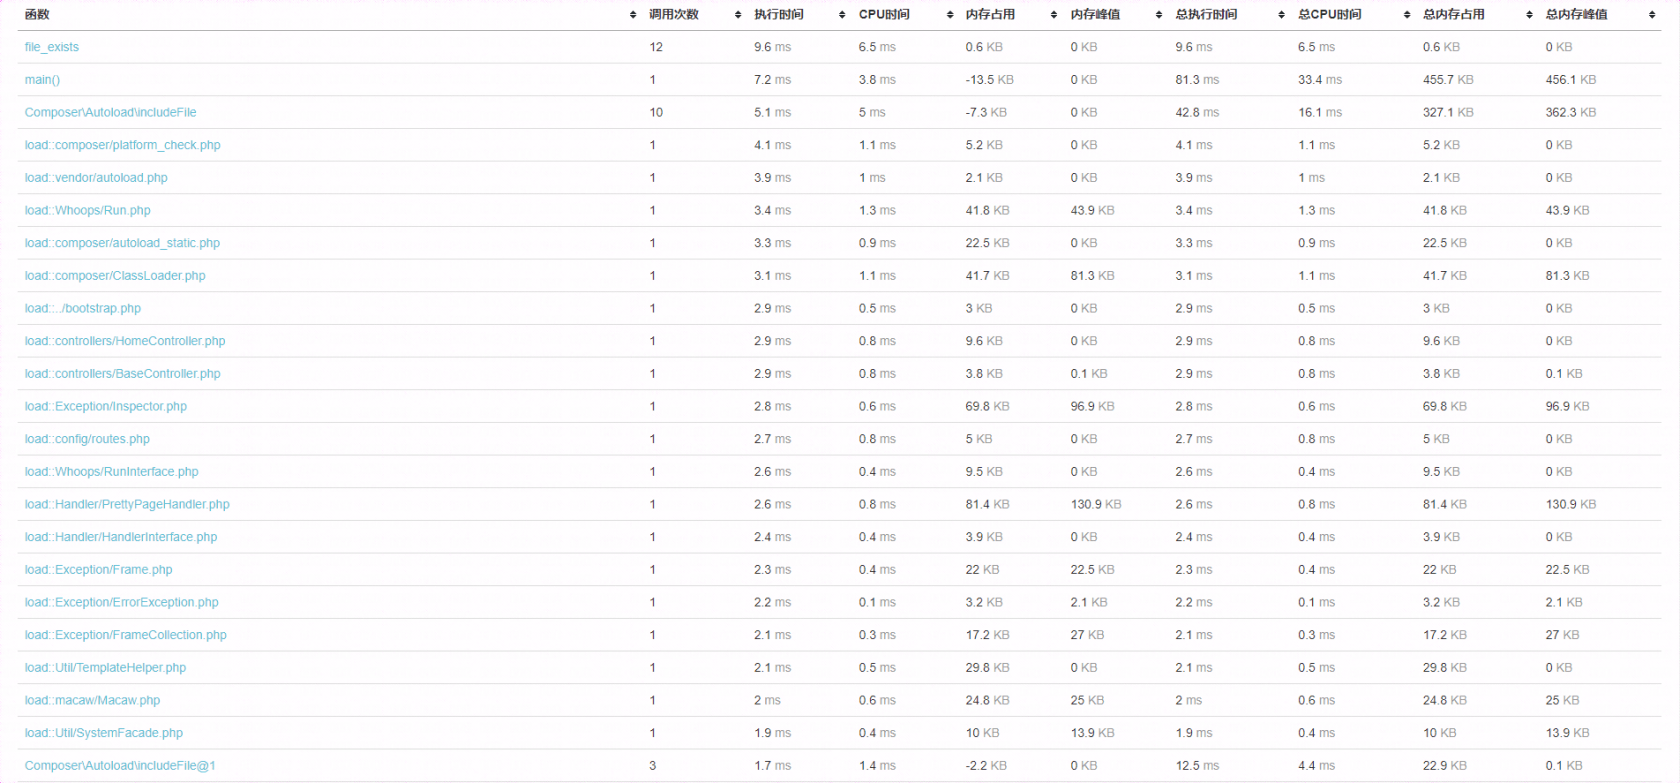
- 点击 “方法” 列,例如 某一行的 GET
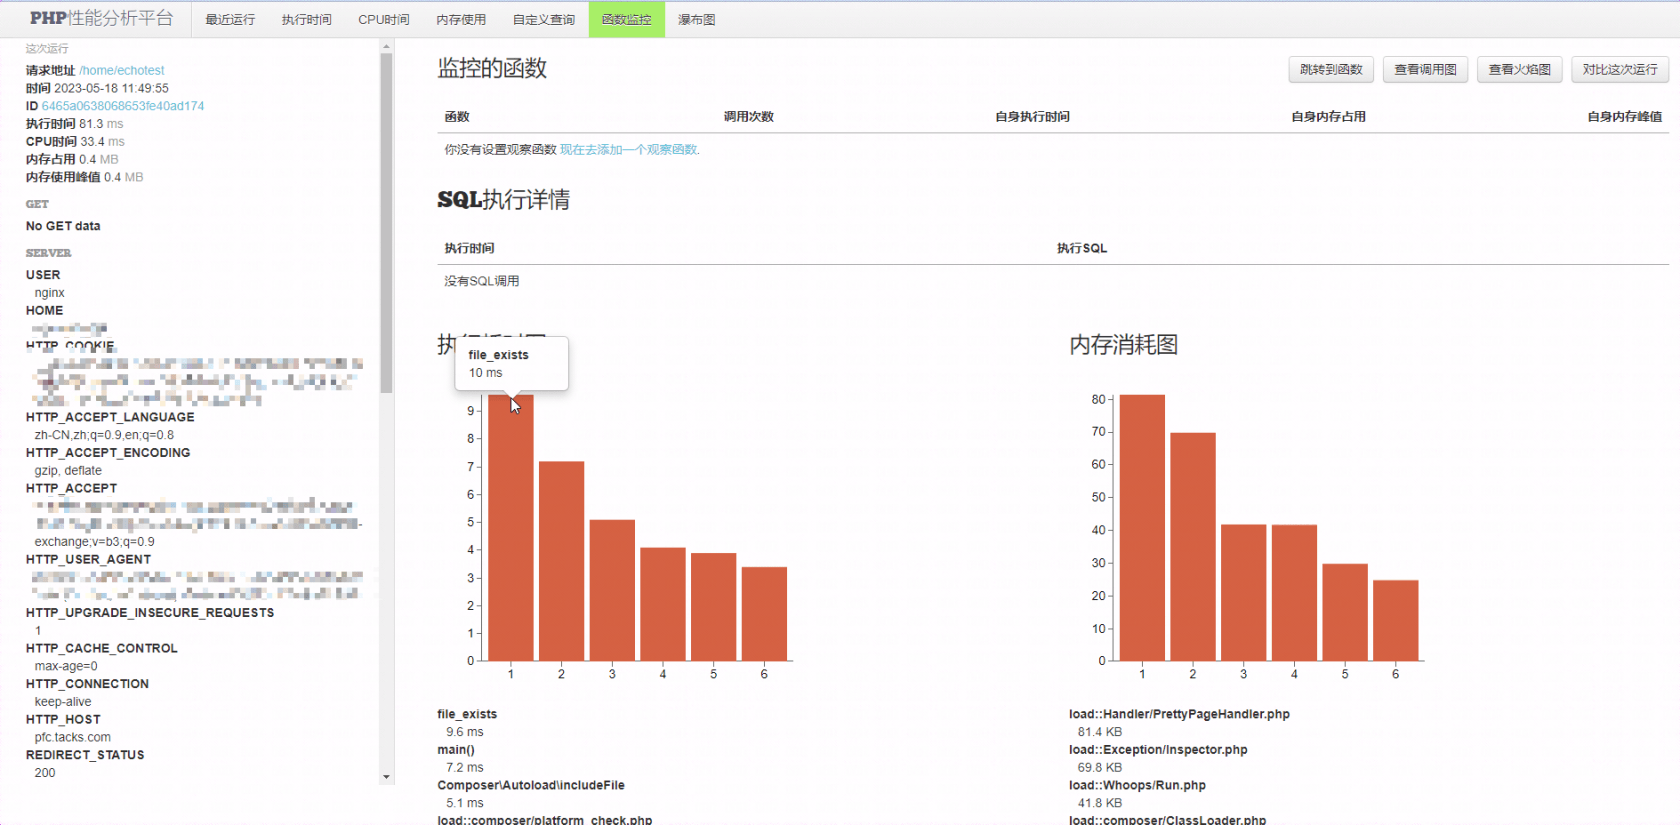
- 点击 “跳转函数” 按钮
- 点击 “查看调用图” 按钮
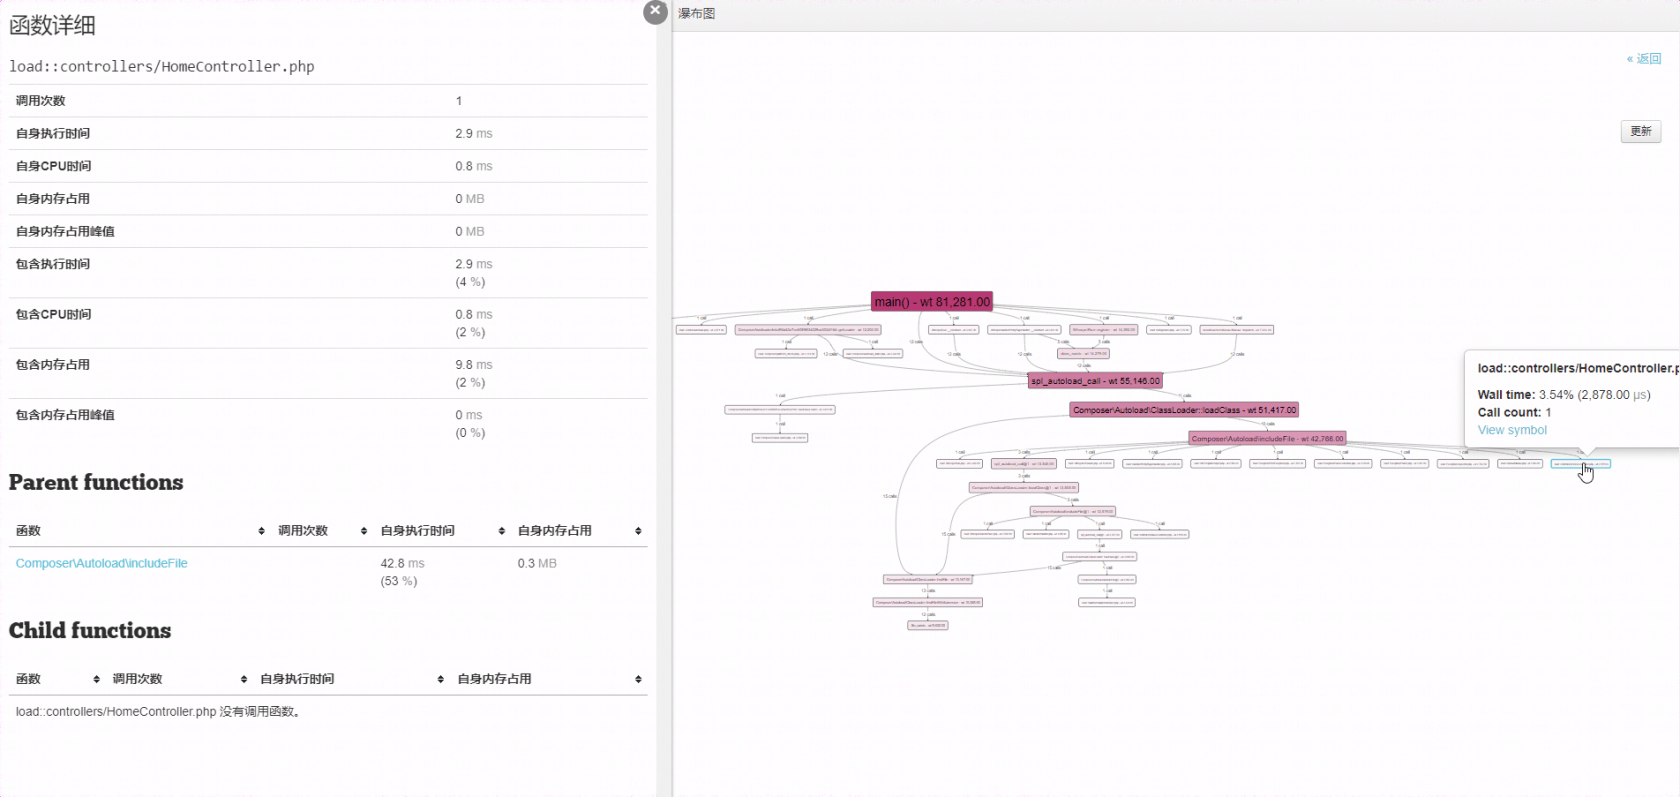
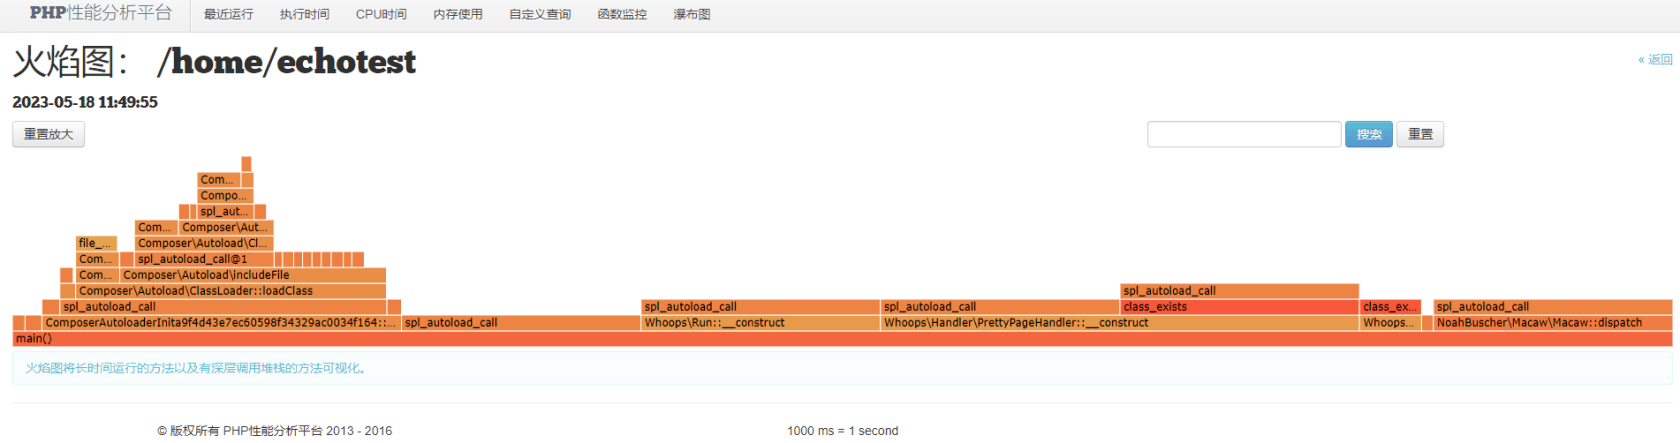
- 点击 “查看火焰图” 按钮
- 点击 “对比这次运行” 按钮

- …
本作品采用《CC 协议》,转载必须注明作者和本文链接


 关于 LearnKu


推荐文章: