
Prometheus 是如何工作的?
5 / 0 / 创建于 1年前
 chaofu 的个人博客
文章来源:Prometheus 如何工作的?
Prometheus works by scraping metrics from configured endpoints at specified intervals. These targets include applications, servers, databases, and more. They expose their metrics in a format Prometheus understands. Once Prometheus pulls metrics from these endpounts, it stores them for querying and retrieval when needed.
Prometheus 的工作原理是按指定的时间间隔从配置的端点抓取指标。这些目标包括应用程序、服务器、数据库等。他们以 Prometheus 理解的格式公开其指标。一旦 Prometheus 从这些端部提取指标,它就会存储它们以供在需要时查询和检索。
How Does Prometheus Work? Prometheus 是如何工作的?
The architecture diagram below provides a summary of how Prometheus works as a monitoring tool.
下面的架构图总结了 Prometheus 如何作为监控工具工作。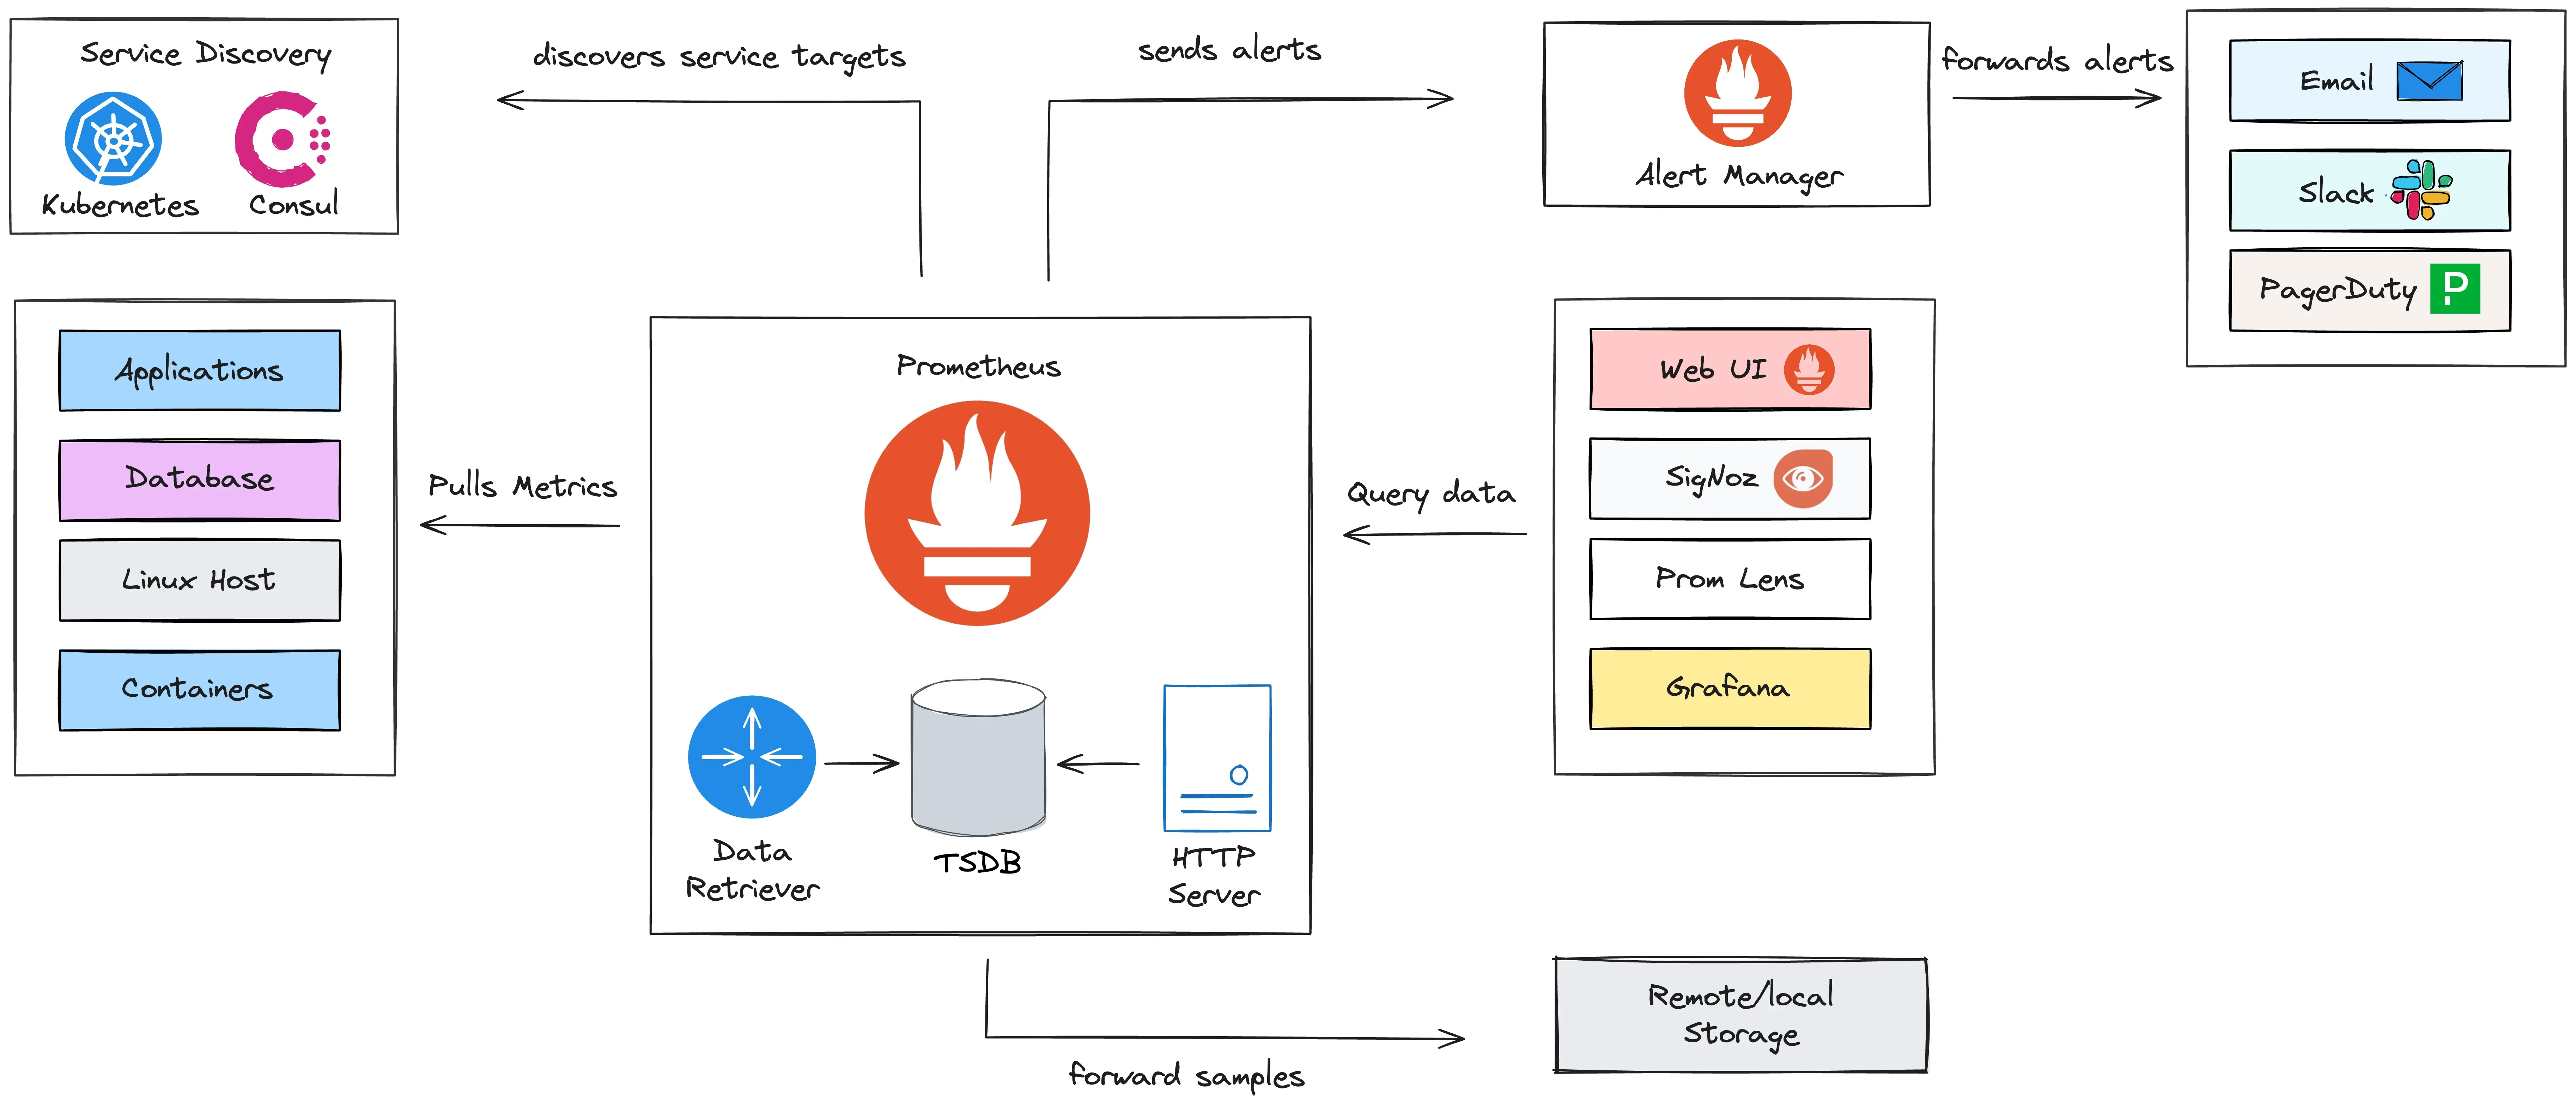
The Prometheus Server Prometheus 服务器
Prometheus has a core component called the Prometheus server, which does the main monitoring work. This server is composed of three parts:
Prometheus 有一个核心组件叫做 Prometheus 服务器,它做主要的监控工作。该服务器由三个部分组成:
Time Series Database: This stores the collected metrics data (e.g., CPU usage, request latency) in a highly efficient format optimized for time-based queries.
时序数据库:它以针对基于时间的查询进行了优化的高效格式存储收集的指标数据(例如,CPU 使用率、请求延迟)。
Data Retriever (Scraper): This worker actively pulls metrics from various sources, including applications, databases, servers, and containers. It then sends the collected data to the time series database for storage.
Data Retriever (Scraper):此工作线程主动从各种来源拉取指标,包括应用程序、数据库、服务器和容器。然后,它将收集的数据发送到时间序列数据库进行存储。
HTTP Server API: This provides a way to query the stored metrics data. This API allows users to retrieve and visualize metrics through tools like the Prometheus dashboard, SigNoz, or Grafana.
HTTP 服务器 API:这提供了一种查询存储的指标数据的方法。此 API 允许用户通过 Prometheus 仪表板、SigNoz 或 Grafana 等工具检索和可视化指标。
Metrics Collection 指标收集
Prometheus collects metrics by periodically scraping targets. A target is any system or service that exposes metrics via an HTTP endpoint. Each target provides units of monitoring specific to its domain. For instance, in an application, metrics might include request latency or number of exceptions, while for a server, metrics could be CPU usage or memory consumption. These units are known as Metrics.
Prometheus 通过定期抓取目标来收集指标。目标是通过 HTTP 端点公开指标的任何系统或服务。每个目标都提供特定于其域的监视单元。例如,在应用程序中,指标可能包括请求延迟或异常数量,而对于服务器,指标可能是 CPU 使用率或内存消耗。这些单位称为“指标”。
For Prometheus to pull metrics from a target, the target must expose a specific HTTP endpoint, typically at the /metrics path. The HTTP endpoints follow the format; hostaddress/metrics. This endpoint provides the current state of the target in a plain text format that Prometheus can understand.
为了让 Prometheus 从目标中提取指标,目标必须公开特定的 HTTP 端点,通常位于路径处/metrics。HTTP 端点遵循以下格式;hostaddress/metrics 。此端点以 Prometheus 可以理解的纯文本格式提供目标的当前状态。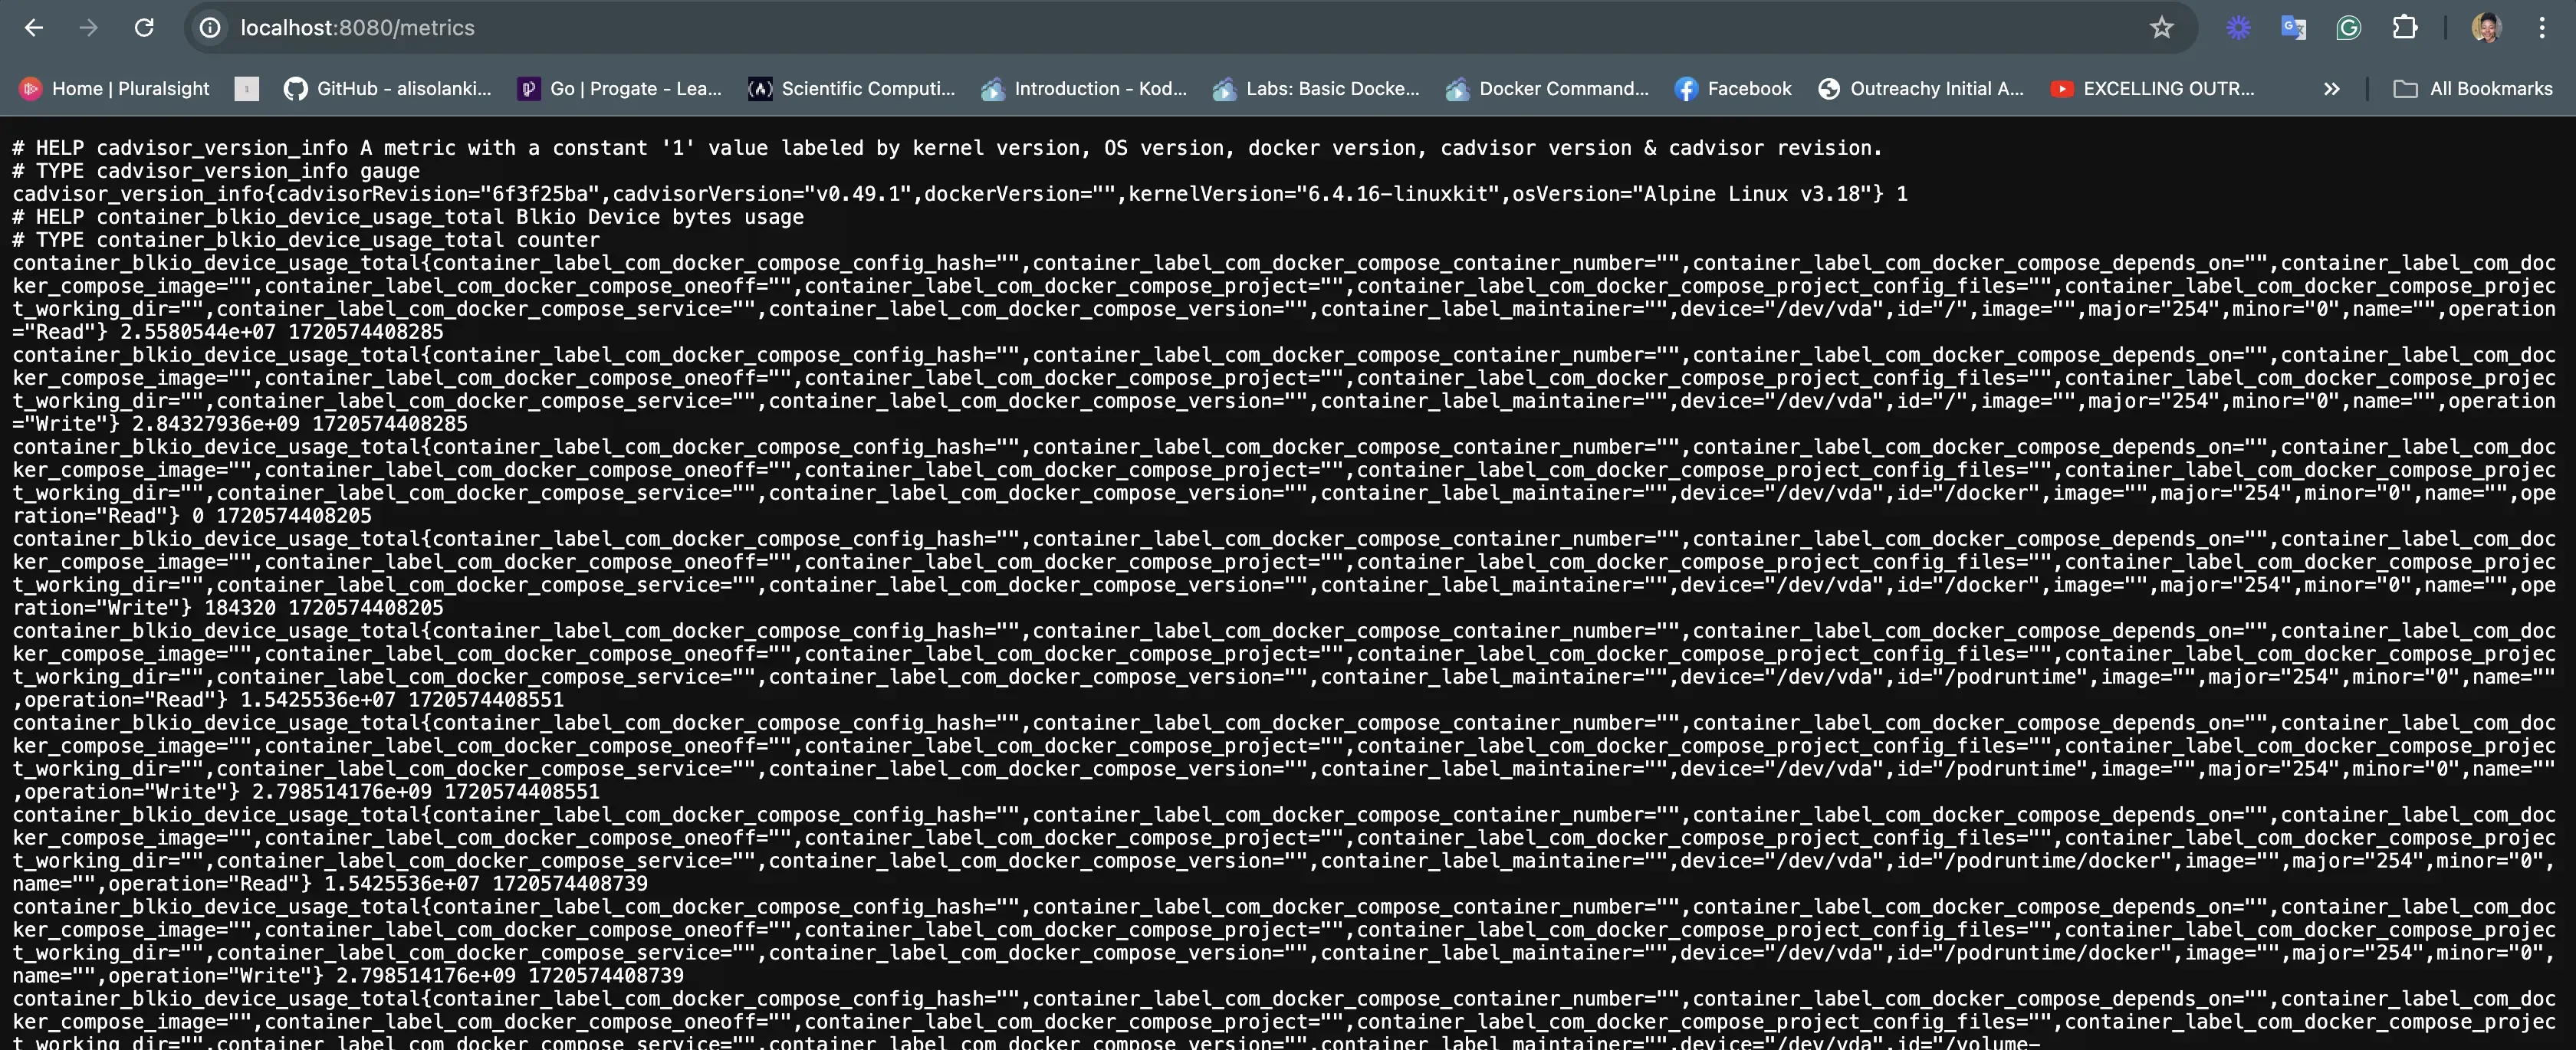
Metrics displayed from an HTTP endpoint (localhost:8080/metrics)
Metrics displayed from an HTTP endpoint (localhost:8080/metrics)
从 HTTP 端点显示的指标 (localhost:8080/metrics)
Exporters
While some systems expose Prometheus endpoints by default, others don’t and require an exporter. An exporter is a service that retrieves metrics from targets and transforms them into a format compatible with Prometheus. These converted metrics are then exposed at the exporter’s /metrics endpoint, where Prometheus can scrape them.
虽然某些系统默认公开 Prometheus 端点,但其他系统则不会,并且需要导出器。导出器是一种服务,它从目标中检索指标并将其转换为与 Prometheus 兼容的格式。然后,这些转换的指标会在导出器的/metrics端点上公开,Prometheus 可以在那里抓取它们。
Prometheus has exporters for different services including MySQL, Elasticssearch, etc. It also provides client libraries for applications that convert metrics data in a Prometheus readable format.
Prometheus 有针对不同服务的导出器,包括 MySQL、Elasticssearch 等。它还为以 Prometheus 可读格式转换指标数据的应用程序提供客户端库。
Scrape Config File Scrape 配置文件
Prometheus has a configuration file, usually named prometheus.yml that defines which targets to scrape and how often. For example:
Prometheus 有一个配置文件,通常命名prometheus.yml,用于定义要抓取的目标以及抓取频率。例如:
scrape_configs:
- job_name: ‘my-app’
scrape_interval: 5s
static_configs:- targets: [‘localhost:8080’]
In the above scrape config, Prometheus is set to scrape metrics from an application running on localhost at port 8080, under the job name my-app. It will do this every 5 seconds.
在上面的抓取配置中,Prometheus 设置为从运行在localhost端口8080的应用程序抓取指标,在作业名称my-app下。它将每 5 秒执行此操作。
Data Storage 数据存储
Once metrics are collected, Prometheus stores them in its time-series database (TSDB). This TSDB is optimized for storing and querying time series data efficiently. It handles millions of metrics with ease and stores data in a compressed format to save space.
收集指标后,Prometheus 会将其存储在其时间序列数据库 (TSDB) 中。此 TSDB 针对高效存储和查询时间序列数据进行了优化。它可以轻松处理数百万个指标,并以压缩格式存储数据以节省空间。
The data is stored locally, providing fast query performance and reliability. Each metric is stored along with a set of labels, which are key-value pairs that identify the metric’s characteristics.
数据存储在本地,提供快速的查询性能和可靠性。每个指标都与一组标签一起存储,这些标签是标识指标特征的键值对。
Data Query 数据查询
The stored metrics data can be queried when needed for visualization through the Prometheus web UI or a monitoring tool.
如果需要通过 Prometheus Web UI 或监控工具进行可视化,可以查询存储的指标数据。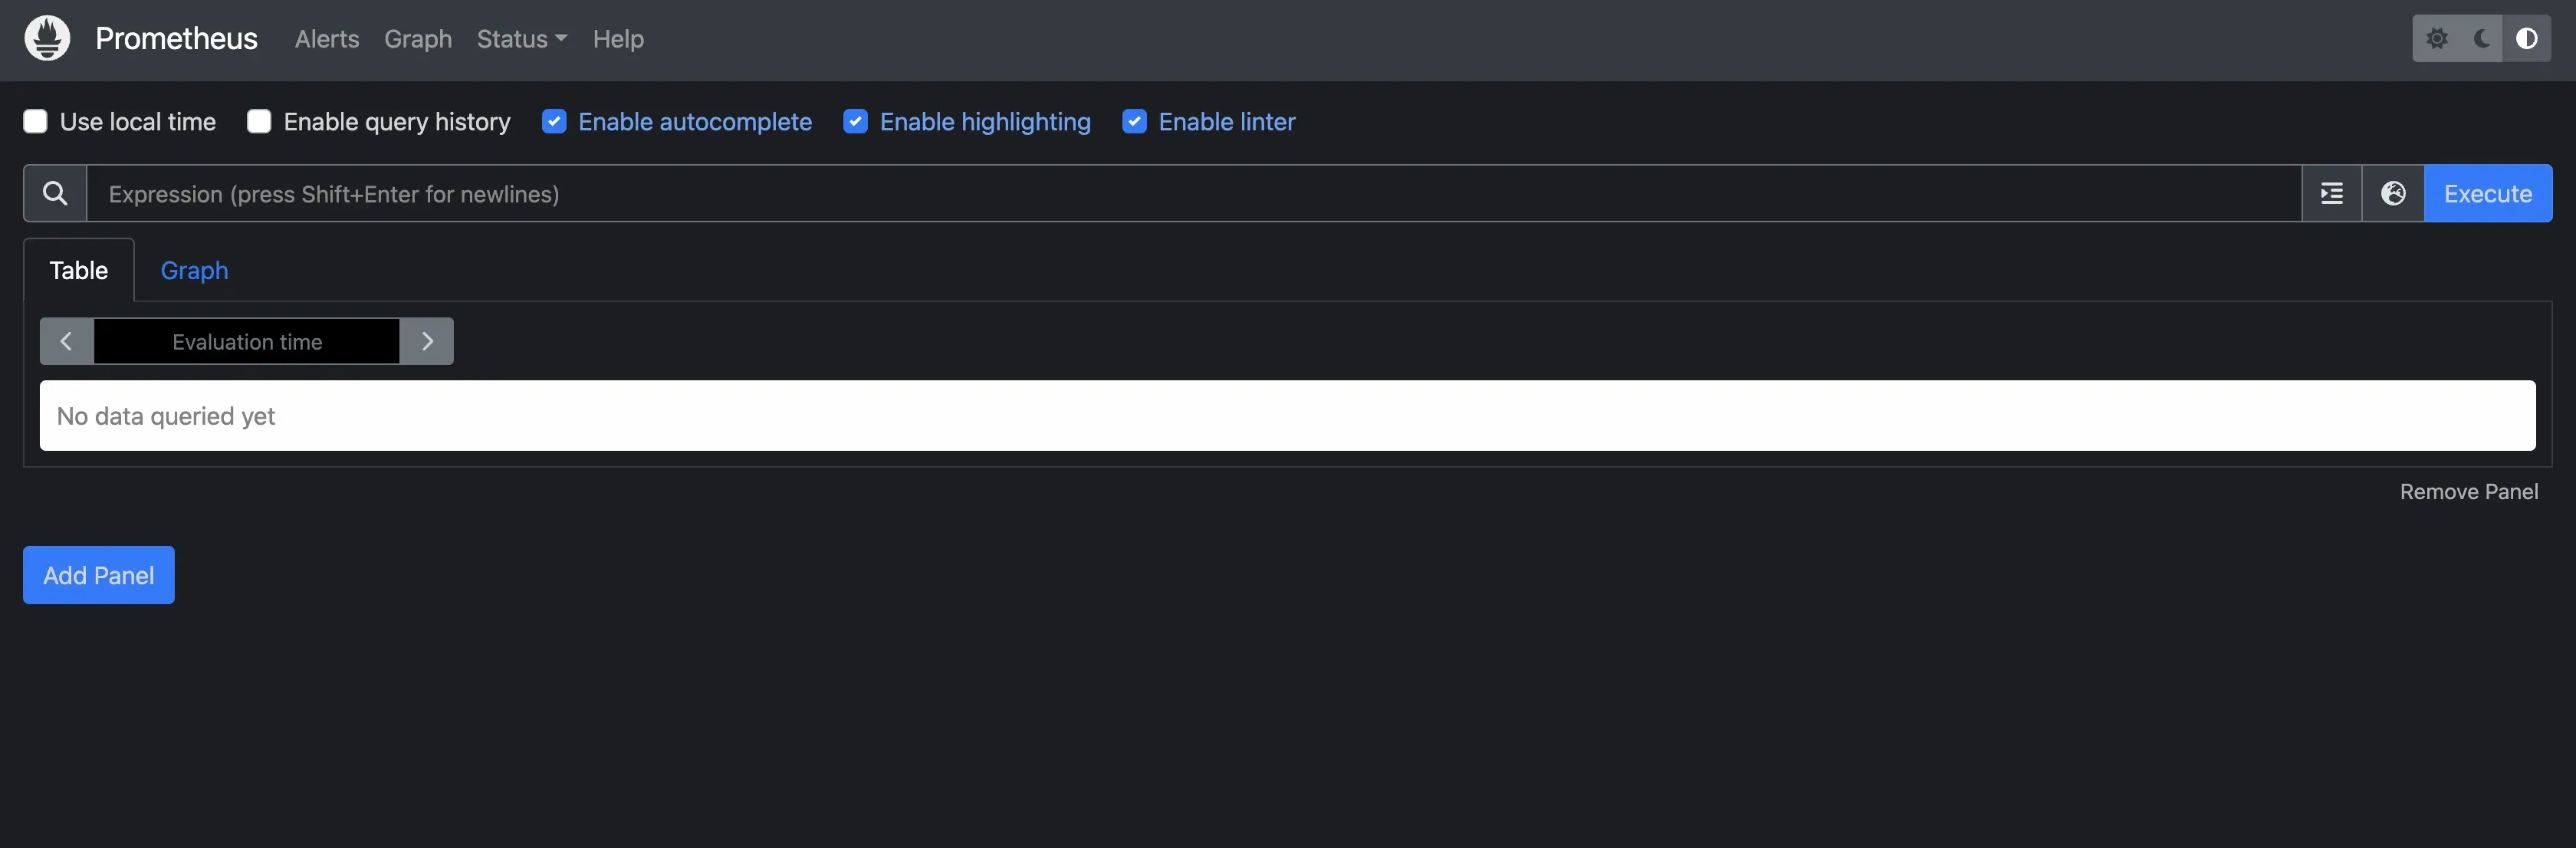
Prometheus provides a powerful query language called PromQL (Prometheus Query Language) to retrieve and manipulate time-series data. PromQL allows users to perform complex queries, aggregations, and transformations on the collected metrics.
Prometheus 提供了一种强大的查询语言,称为 PromQL(Prometheus 查询语言),用于检索和操作时间序列数据。PromQL 允许用户对收集的指标执行复杂的查询、聚合和转换。
Example of a PromQL query:
PromQL 查询示例: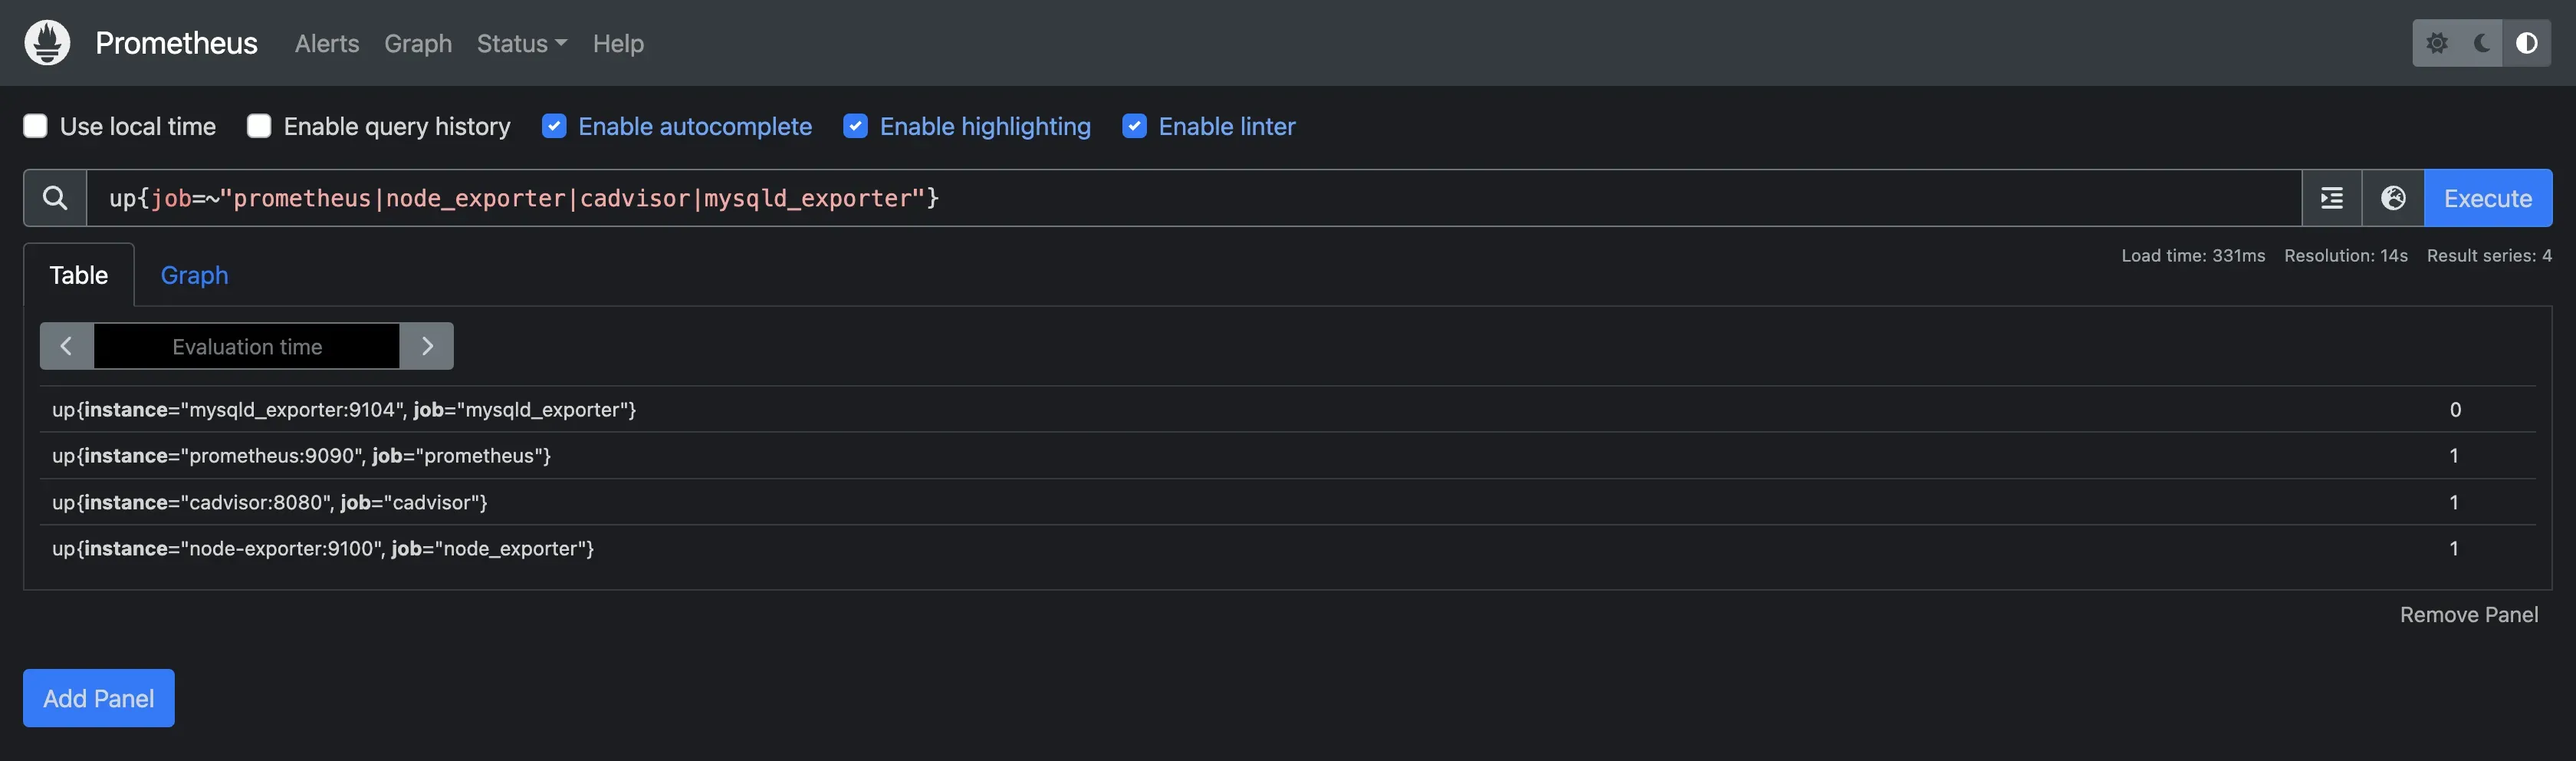
This query checks the status of targets (Prometheus, node_exporter, cadvisor, or mysqld_exporter) and returns whether they are up (1) or down (0).
此查询检查目标(Prometheus、node_exporter、cadvisor 或 mysqld_exporter)的状态,并返回它们是启动 (1) 还是关闭 (0)。
Alerting 警报
For effective monitoring, Prometheus includes a built-in alerting mechanism that allows users to define alerting rules based on PromQL queries. Alerting rules are defined to specify conditions under which alerts should be triggered. These rules evaluate metrics at regular intervals.
为实现有效监控,Prometheus 包含一个内置警报机制,允许用户根据 PromQL 查询定义警报规则。定义警报规则是为了指定触发警报的条件。这些规则定期评估指标。
For example: 例如
groups:
- name: example-alert
rules:- alert: ContainerKilled
expr: ‘time() - container_last_seen > 60’
for: 0m
labels:
severity: warning
annotations:
summary: Container killed (instance {{ $labels.instance }})
description: “A container has disappeared\n VALUE = {{ $value }}\n LABELS = {{ $labels }}”
The above alerting rule checks if a container has not been seen in the last 60 seconds and triggers an alert immediately with a warning severity, providing a summary and description with relevant details.
上述警报规则会检查是否在过去 60 秒内未出现过容器,并立即触发警告严重性警报,提供包含相关详细信息的摘要和描述。
- alert: ContainerKilled
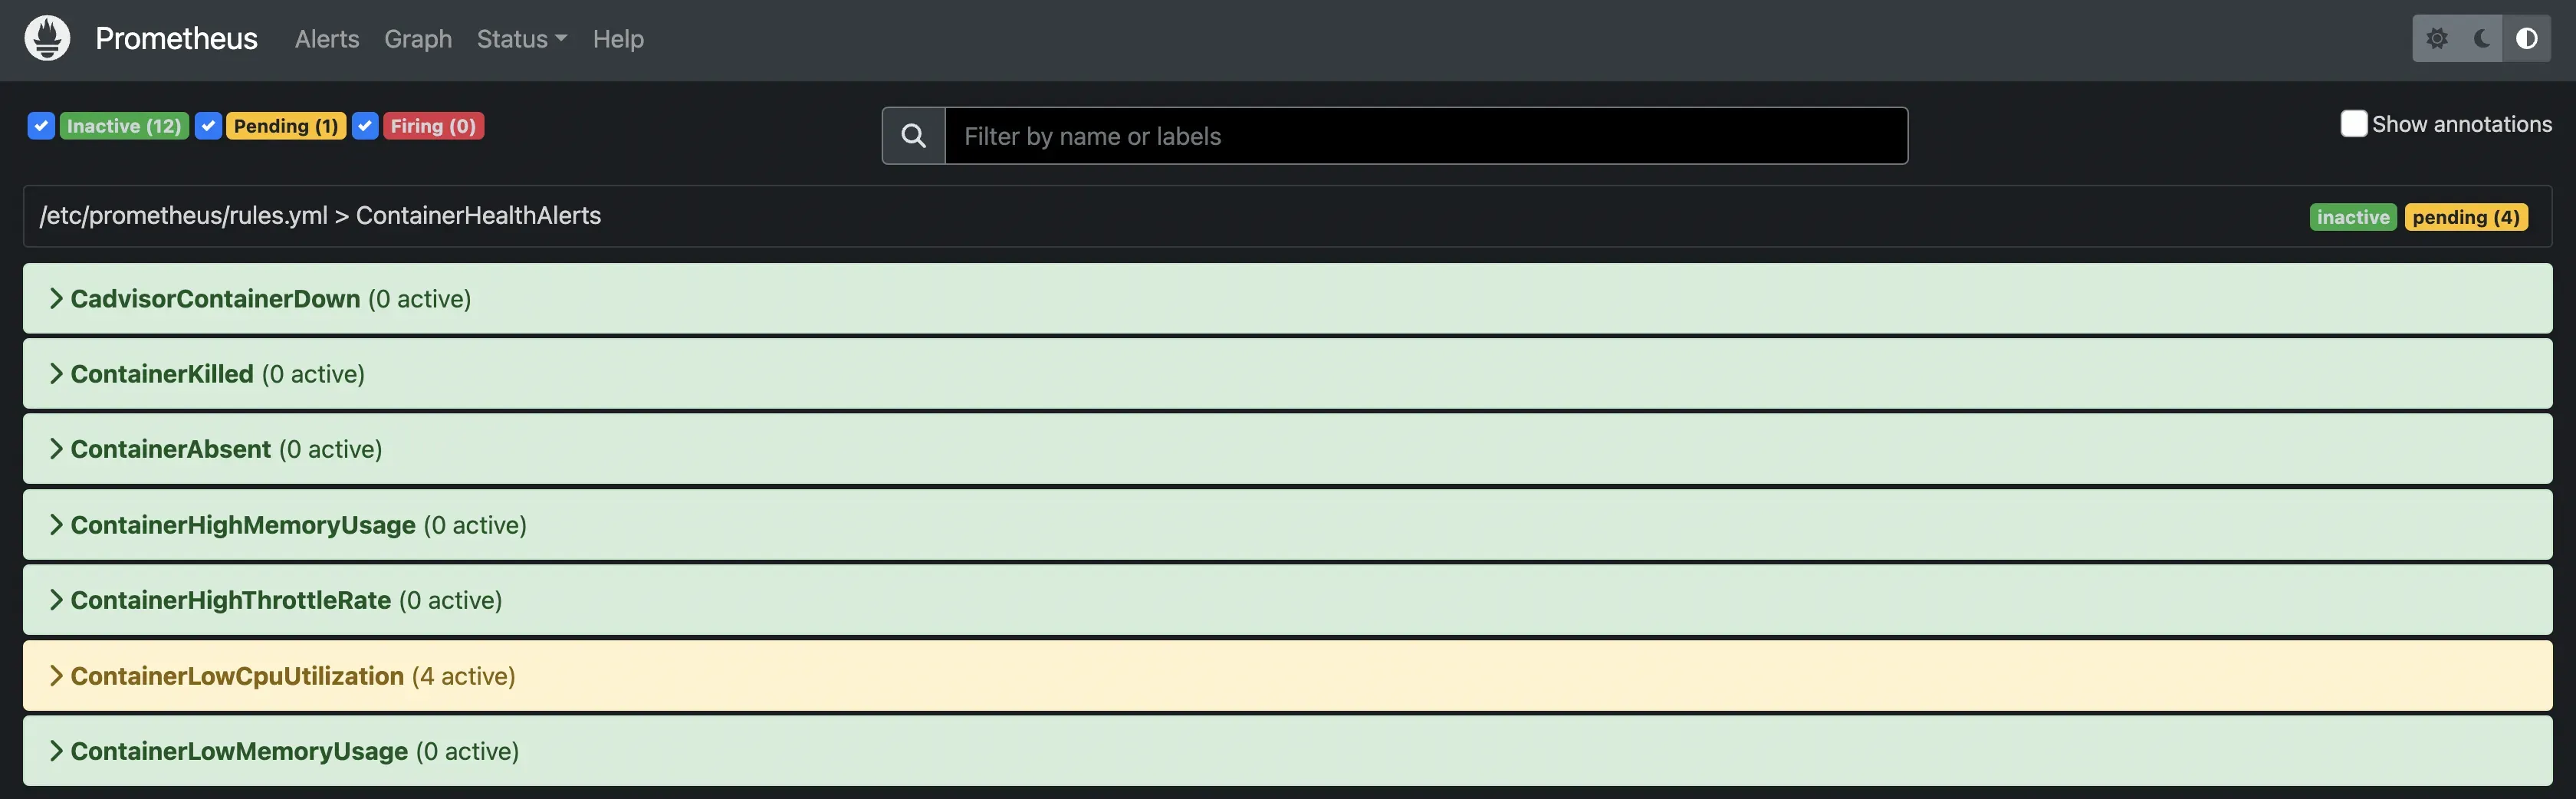
An alert can be in one of three states:
警报可以处于三种状态之一:
Inactive: This is the default state of an alert. It means that the condition specified in the alerting rule is not currently met. No actions are taken when an alert is inactive.
未激活:这是警报的默认状态。它表示当前不符合警报规则中指定的条件。当警报处于非活动状态时,不会执行任何操作。
Pending: The is when the condition specified in the alerting rule has been met, but the for clause hasn’t expired yet. The for clause specifies a duration for which the condition must remain true before the alert fires. This acts as a buffer to prevent alerts from triggering due to transient spikes or temporary issues.
待处理:是指警报规则中指定的条件已满足,但 for 子句尚未过期。for 子句指定了在警报触发前条件必须保持为真的持续时间。这可以作为一个缓冲,防止因瞬时峰值或临时问题触发警报。
Firing: The alert transitions to this state if the condition specified in the alerting rule remains true for the duration specified in the for clause.
触发:如果警报规则中指定的条件在 for 子句中指定的持续时间内保持为真,警报就会过渡到这种状态。
Alerts in the firing state are sent out the alert to Alertmanager, which then handles routing the alert to the configured receiver integrations (e.g., email, Slack, PagerDuty).
处于触发状态的警报会被发送到 Alertmanager,然后 Alertmanager 会将警报路由到已配置的接收器集成(如电子邮件、Slack、PagerDuty)。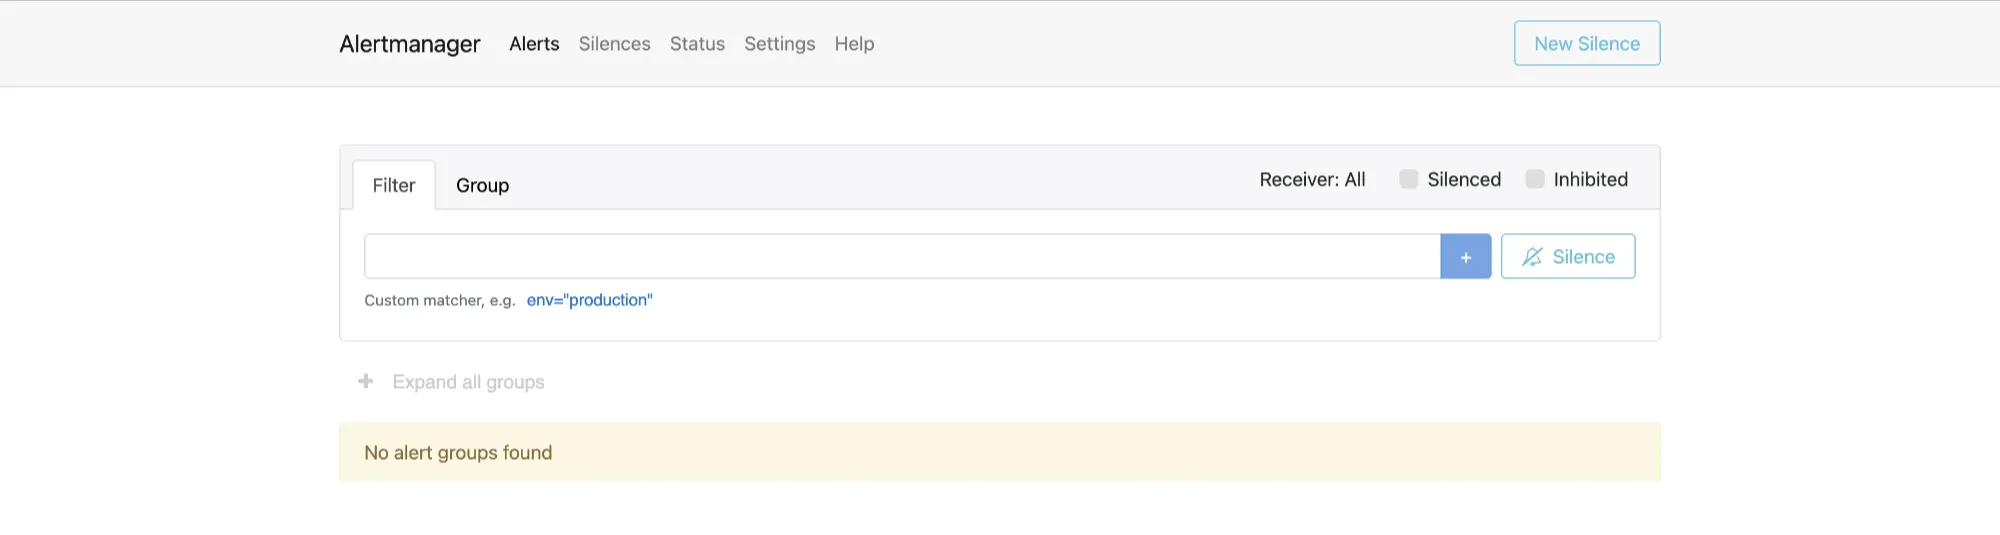
Service Discovery 服务发现
Prometheus also supports various service discovery mechanisms to find targets automatically. This is particularly useful in dynamic environments like Kubernetes, where services may start and stop frequently. If you also deploy a new application or service in such environments, Prometheus immediately discovers it and starts monitoring it.
Prometheus 还支持各种服务发现机制来自动查找目标。这在像 Kubernetes 这样的动态环境中特别有用,其中服务可能会频繁启动和停止。如果您还在此类环境中部署新的应用程序或服务,Prometheus 会立即发现它并开始监控它。
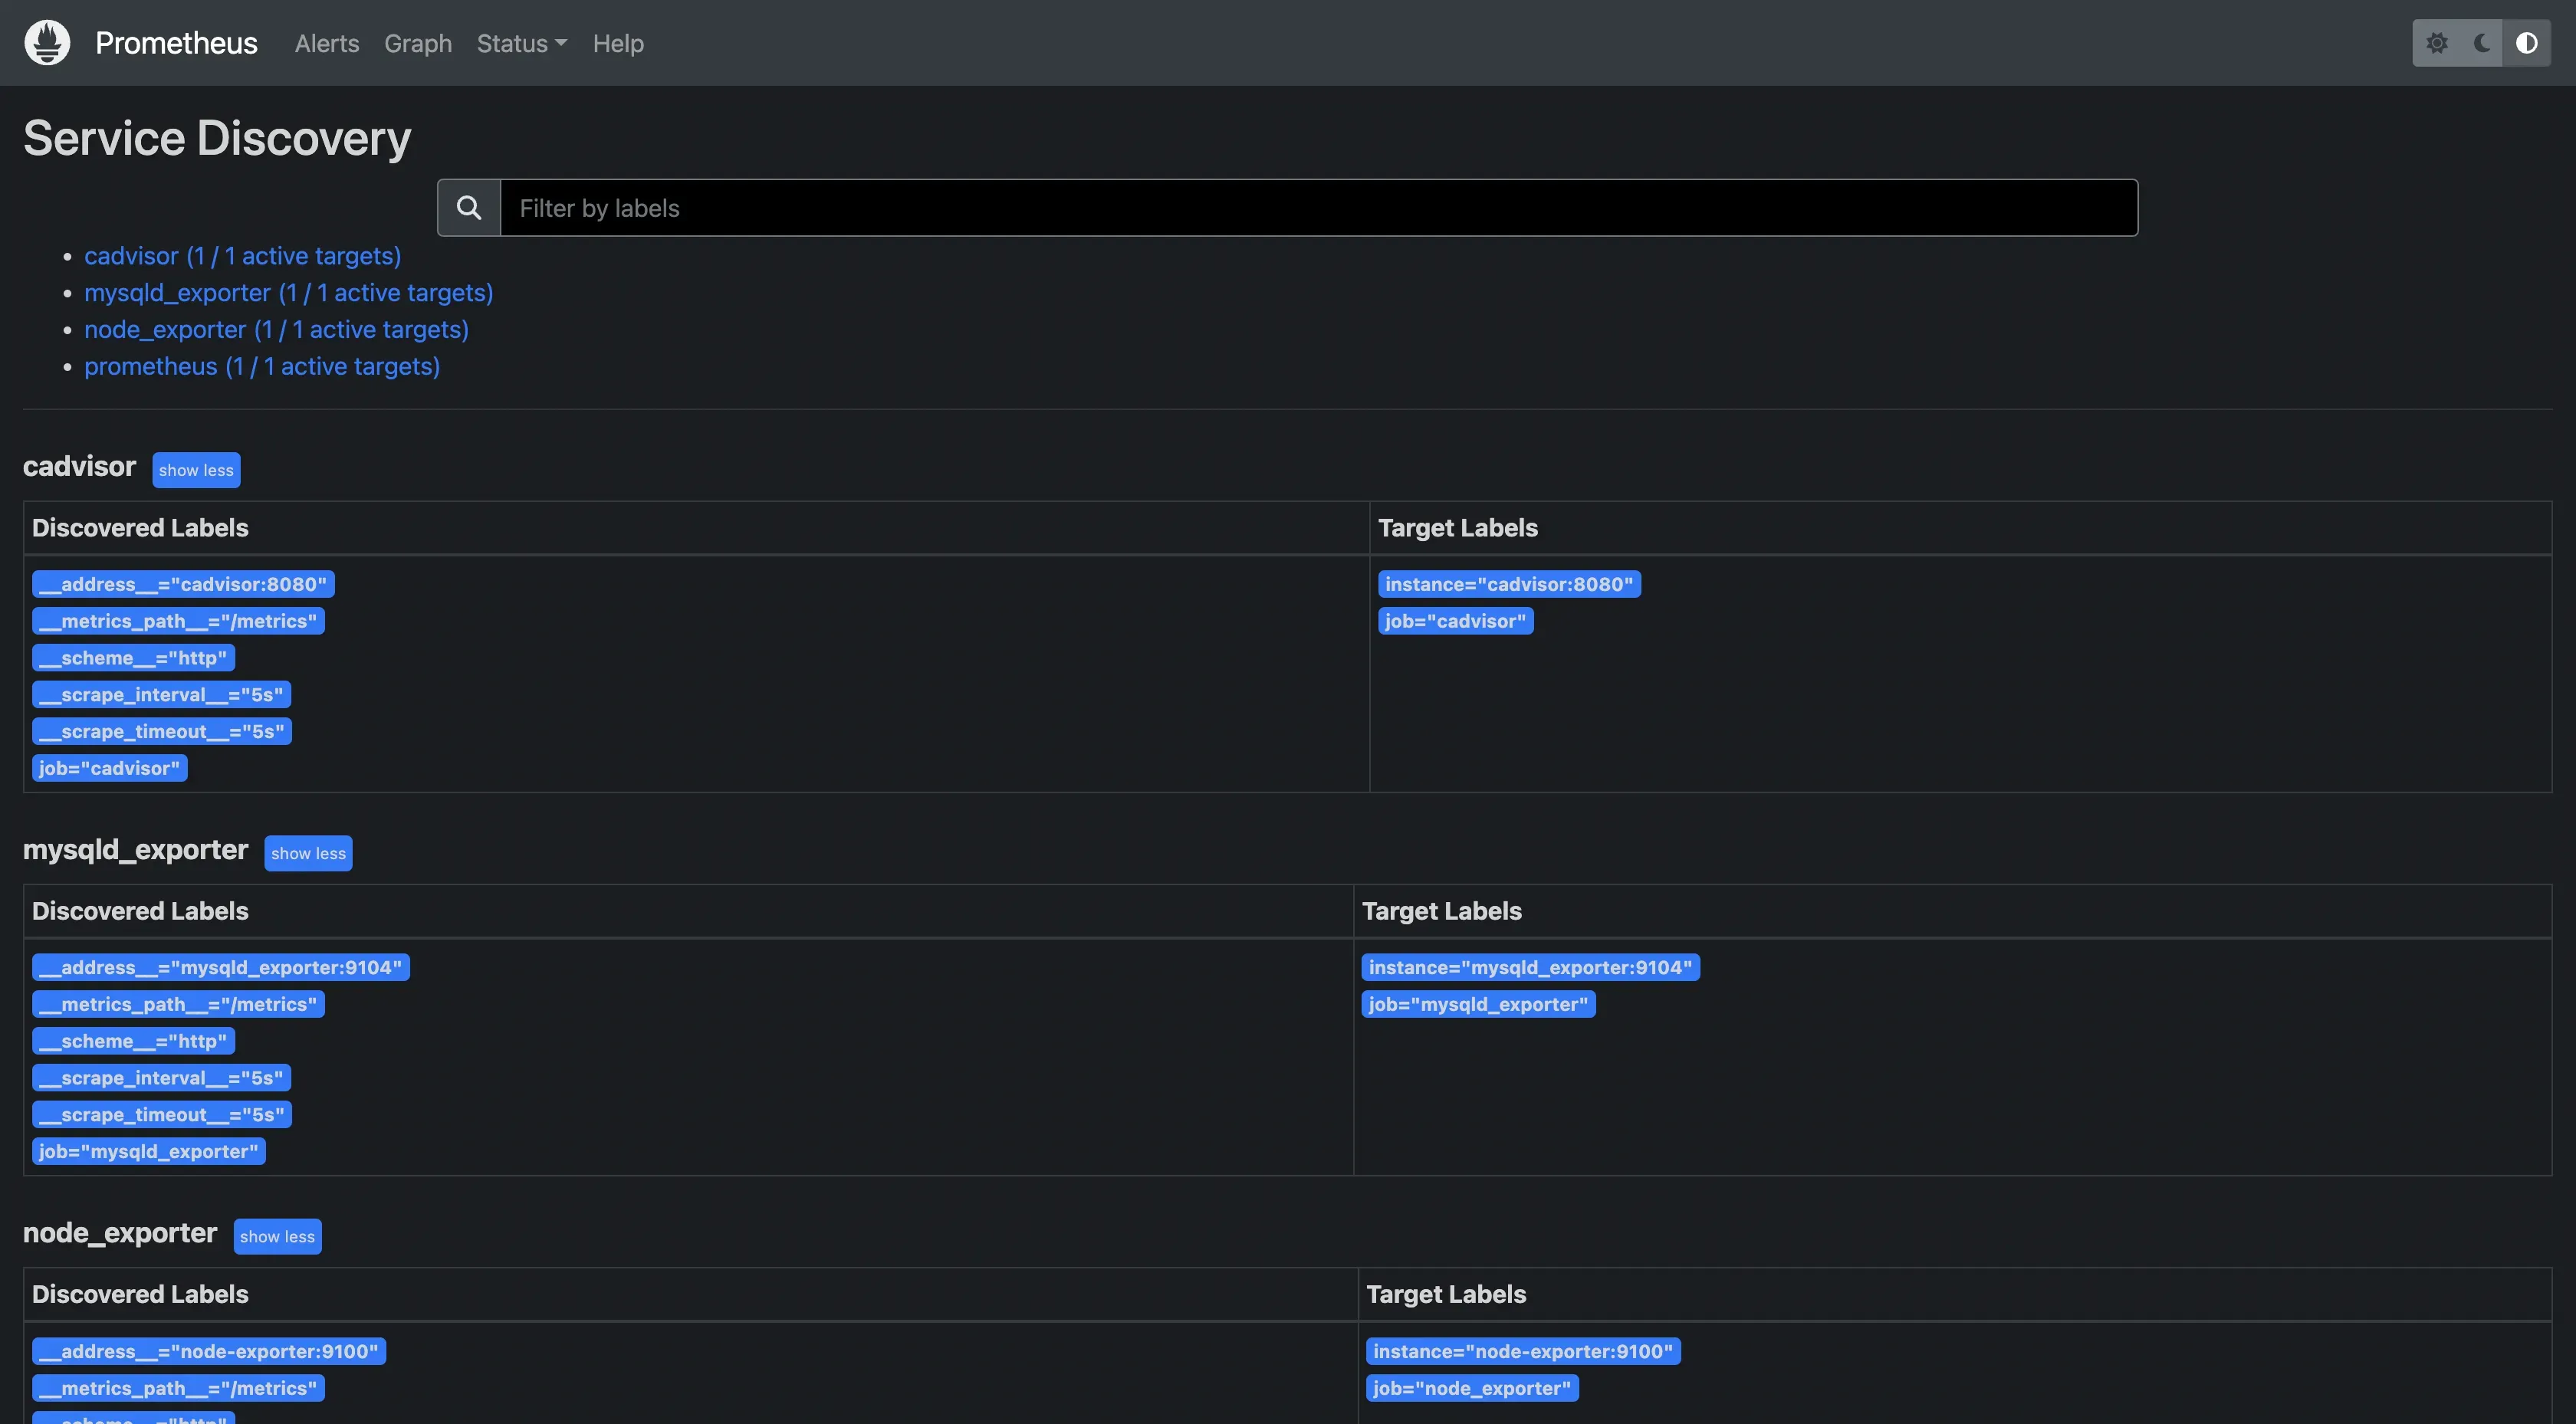
Prometheus service discovery
Prometheus service discovery 普罗米修斯服务发现
Example of how service discovery is configured for Kubernetes:
如何为 Kubernetes 配置服务发现的示例:
scrape_configs:
- job_name: ‘kubernetes-apiservers’
kubernetes_sd_configs:- role: endpoints
Other supported service discovery mechanisms include static configuration, DNS, Consul, Marathon, and more.
其他支持的服务发现机制包括静态配置、DNS、Consul、Marathon 等。
- role: endpoints
Quick Start with Prometheus 普罗米修斯快速入门
This quick start guide will help you get Prometheus up and running in a few simple steps.
本快速入门指南将帮助您通过几个简单的步骤启动并运行 Prometheus。
Download Prometheus 下载普罗米修斯
To download Prometheus on your system, visit the Prometheus download page. Set your system architecture and identify the appropriate package for your operating system (Linux, macOS, Windows). Click on the download link for the latest stable release.
要在您的系统上下载 Prometheus,请访问 Prometheus 下载页面。设置您的系统架构并确定适合您的操作系统(Linux、macOS、Windows)的软件包。单击最新稳定版本的下载链接。
Download Prometheus
Download Prometheus 下载普罗米修斯
Configure prometheus.yml file 配置prometheus.yml文件
After downloading Prometheus, extract the tarball downloaded file. You’ll find a file named prometheus.yml in the extracted directory.
下载 Prometheus 后,解压缩下载的 tarball 文件。您将在提取的目录中找到一个名为 prometheus.yml 的文件。
Extracted Prometheus folder
Extracted Prometheus folder 提取的 Prometheus 文件夹
Prometheus uses a configuration file named prometheus.yml to specify which targets to monitor and how to scrape them. Open prometheus.yml in a text editor.
Prometheus 使用名为 prometheus.yml 的配置文件来指定要监视的目标以及如何抓取它们。在文本编辑器中打开 prometheus.yml。
Prometheus.yml file
Prometheus.yml file 普罗米修斯.yml 文件
In the prometheus.yml file, you will see that Prometheus is configured to scrape metrics from itself. You can add other scrape configurations for Prometheus to scrape metrics from different targets on your system.
在 prometheus.yml 文件中,您将看到 Prometheus 配置为从自身抓取指标。您可以为 Prometheus 添加其他抓取配置,以从系统上的不同目标抓取指标。
Start Prometheus server 启动普罗米修斯服务器
Navigate to the directory where you extracted Prometheus and execute the following command to start Prometheus:
导航到解压 Prometheus 的目录并执行以下命令启动 Prometheus:
./prometheus –config.file=prometheus.yml
This command will start Prometheus and use the specified configuration file to determine which targets to scrape.
此命令将启动 Prometheus 并使用指定的配置文件来确定要抓取的目标。
Prometheus started
Prometheus started 普罗米修斯开始了
Access the Prometheus UI 访问普罗米修斯用户界面
Once Prometheus has started, in your browser, visit localhost:9090 to access the Prometheus UI:
Prometheus 启动后,在浏览器中访问 localhost:9090 以访问 Prometheus UI:
Prometheus UI
Prometheus UI 普罗米修斯用户界面
Prometheus targets
Prometheus targets 普罗米修斯目标
Conclusion 结论
This article discussed how monitoring in Prometheus works. It highlighted some of the key components of Prometheus and their roles in monitoring.
本文讨论了 Prometheus 中的监控如何工作。它强调了 Prometheus 的一些关键组件及其在监控中的作用。
Key takeaways: 要点:
Prometheus collects metrics by scraping HTTP target endpoints exposing metrics in a Prometheus format.
Prometheus 通过抓取 HTTP 目标端点来收集指标,以 Prometheus 格式公开指标。
Exporters are used in converting metrics to Prometheus formats.
导出器用于将指标转换为 Prometheus 格式。
Prometheus stores data in its time series database for retrieval at any time.
Prometheus 将数据存储在其时间序列数据库中,以便随时检索。
Metrics data can be queried using PromQL, the Prometheus query language.
可以使用 PromQL(Prometheus 查询语言)查询指标数据。
Prometheus has a built-in Alert Manager component for alerting and routing
Prometheus 有一个内置的警报管理器组件,用于警报和路由
本作品采用《CC 协议》,转载必须注明作者和本文链接


 关于 LearnKu


推荐文章: