
 Tokio 中文文档
Next steps with Tracing
这是一篇协同翻译的文章,你可以点击『我来翻译』按钮来参与翻译。
Next steps with Tracing
Tokio-console
tokio-console is an htop-like utility that enables you to see a real-time view of an application’s spans and events. It can also represent "resources" that the Tokio runtime has created, such as Tasks. It's essential for understanding performance issues during the development process.
For instance, to use tokio-console in the mini-redis project, you need to enable the tracing feature for the Tokio package:
tokio = { version = "1", features = ["full", "tracing"] }Note: The full feature doesn't enable tracing.
You'll also need to add a dependency on the console-subscriber package. This crate provides a Subscriber implementation that will replace the one currently used by mini-redis:
console-subscriber = "0.1.5"Finally, in src/bin/server.rs, replace the call to tracing_subscriber with the call to console-susbcriber:
Replace this:
tracing_subscriber::fmt::try_init()?;...with this:
console_subscriber::init();This will enable the console_subscriber, which means that any instrumentation relevant to tokio-console will be recorded. Logging to stdout will still happen (based on the value of the RUST_LOG environment variable).
Now we should be ready to start up mini-redis again, this time using the tokio_unstable flag (which is needed to enable tracing):
RUSTFLAGS="--cfg tokio_unstable" cargo run --bin mini-redis-serverThe tokio_unstable flag allows us to make use of additional APIs provided by Tokio which do not currently have a guarantee of stability (in other words, breaking changes are allowed for these APIs).
All that is remaining is to run the console itself in another terminal. The easiest way to do that would be to install it from crates.io:
cargo install --locked tokio-consoleand then run it with:
tokio-consoleThe initial view you will see is for tokio Tasks that are currently running. Example: 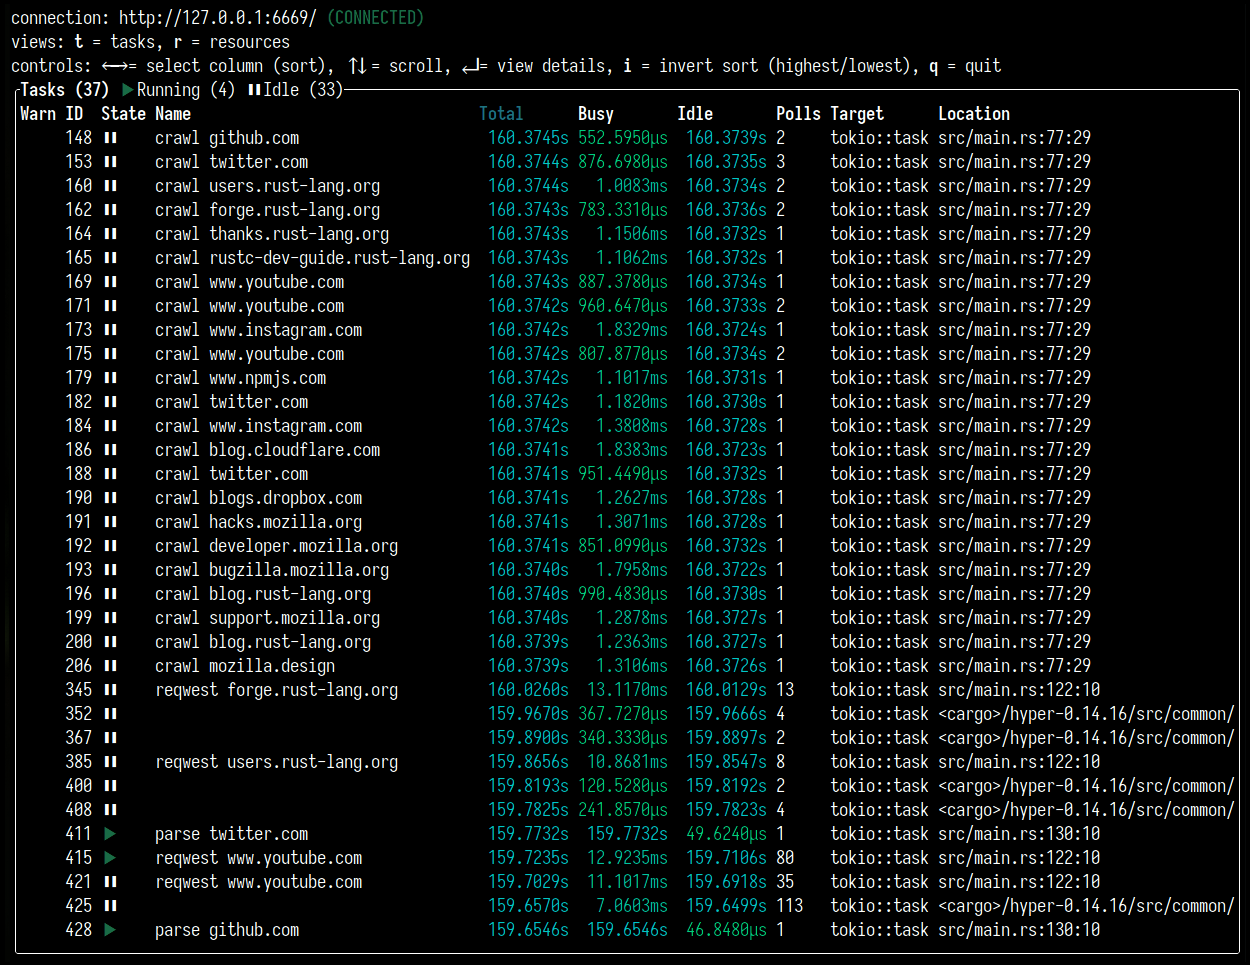
It can also show Tasks for a period of time after they have completed (the color for these will be grey). You can generate some traces by running the mini-redis hello world example (this is available in the mini-redis repository):
cargo run --example hello_worldIf you press r, you can switch to the Resources view. This displays semaphores, mutexes, and other constructs that are being used by the Tokio runtime. Example: 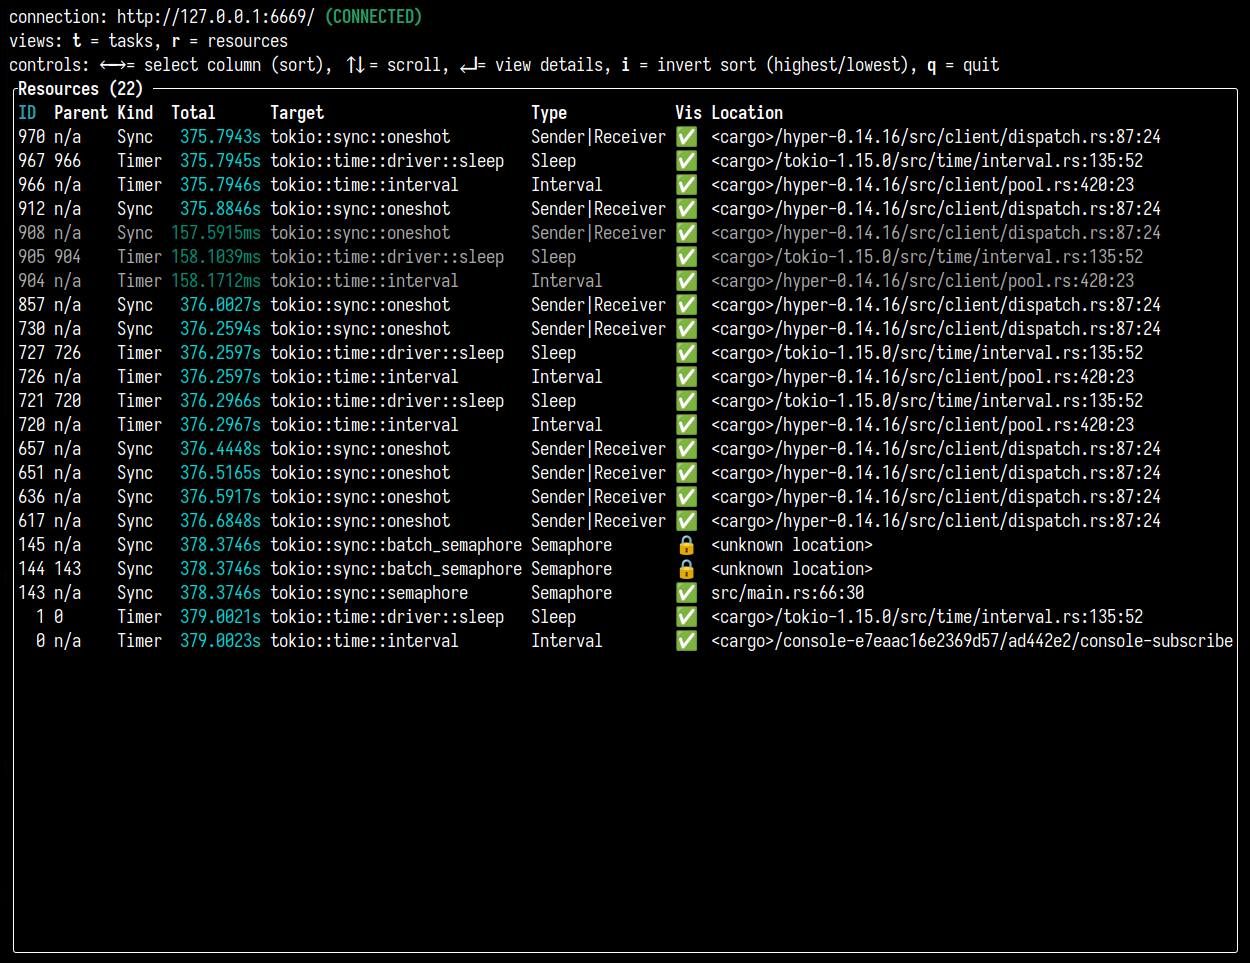
Whenever you need to introspect the Tokio runtime to understand the performance of you application better, you can make use of tokio-console to view what is happening in real time, helping you to spot deadlocks and other issues.
To learn more about how to use tokio-console, please visit its documentation page.
Integrating with OpenTelemetry
OpenTelemetry (OTel) means multiple things; for one, it's an open specification, defining a data model for traces and metrics that can handle the needs of most users. It is also a set of language-specific SDKs, providing instrumentation so that traces and metrics can be emitted from an application. Thirdly, there is the OpenTelemetry Collector, a binary that runs alongside your application to collect the traces and metrics, ultimately pushing those out to a telemetry vendor, such as DataDog, Honeycomb, or AWS X-Ray. It can also send data to tools such as Prometheus instead.
The opentelemetry crate is what provides the OpenTelemetry SDK for Rust, and is what we will be using for this tutorial.
In this tutorial, we will be setting up mini-redis to send data to Jaeger, which is a UI for visualizing traces.
To run an instance of Jaeger, you can use Docker:
docker run -d -p6831:6831/udp -p6832:6832/udp -p16686:16686 -p14268:14268 jaegertracing/all-in-one:latestYou can visit the Jaeger page by going to http://localhost:16686. It will look like this: 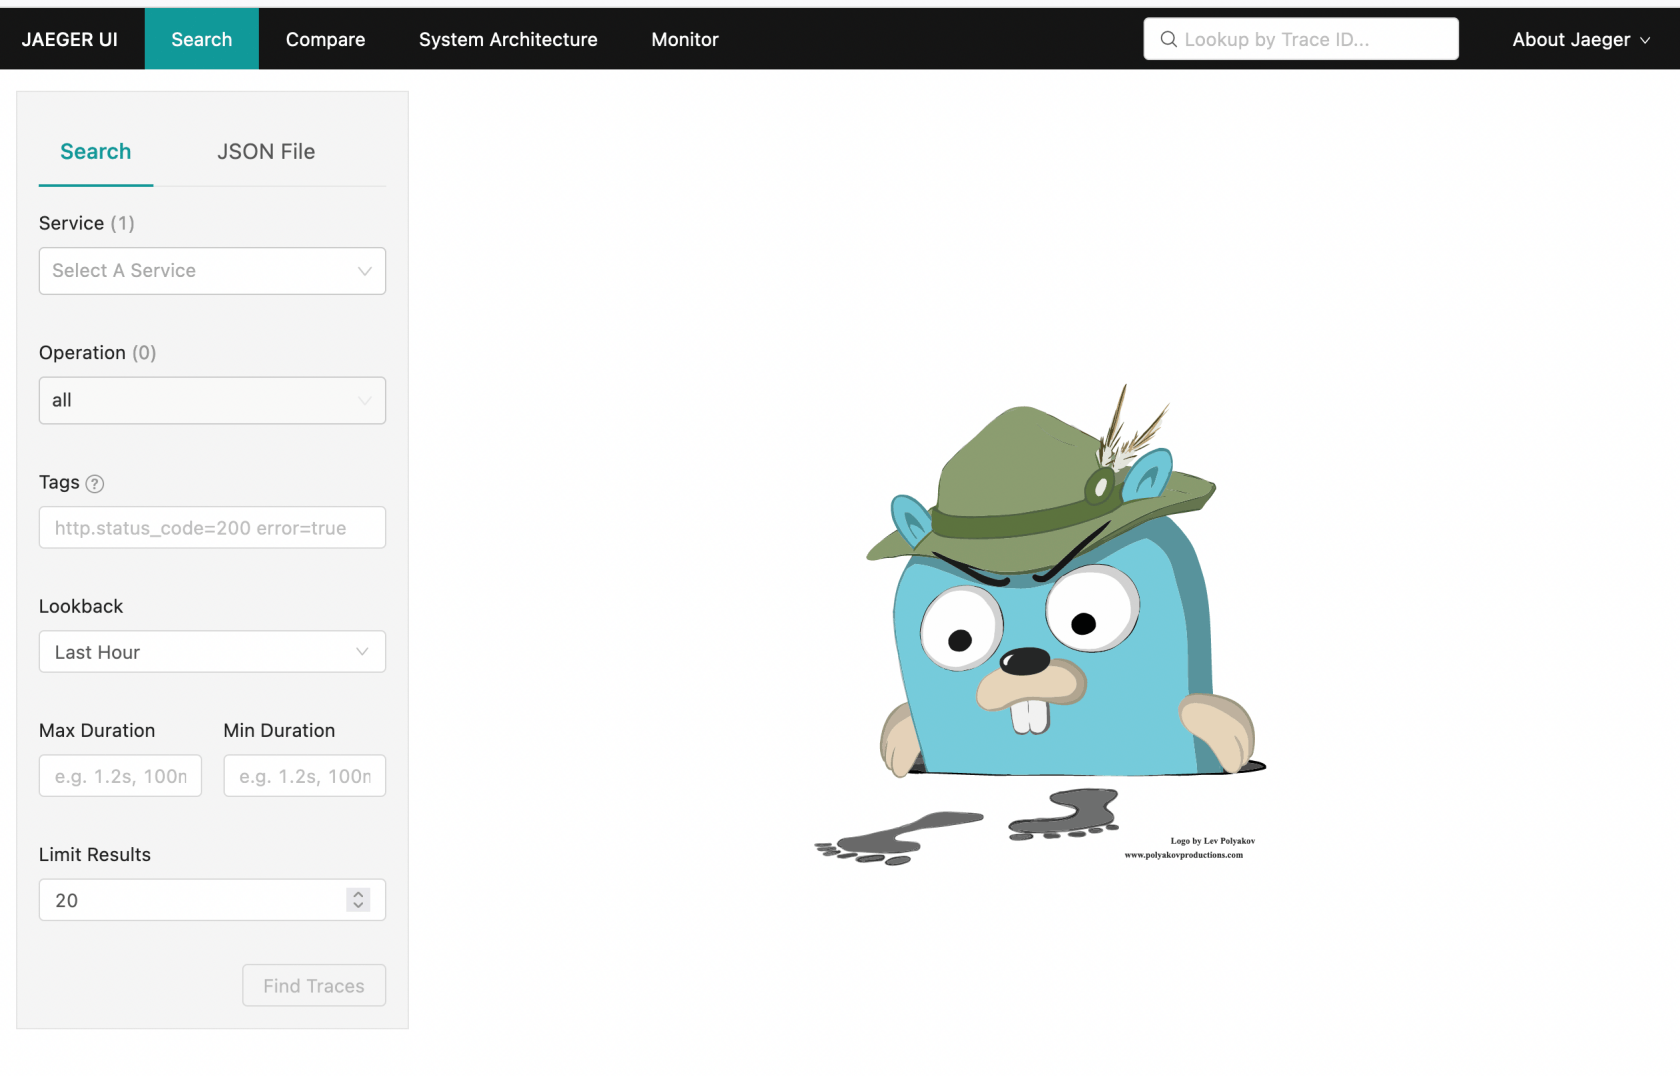
We'll come back to this page once we have some trace data generated and sent.
To set up mini-redis, we'll first need to add a few dependencies. Update your Cargo.toml with the following:
opentelemetry = "0.17.0"
tracing-opentelemetry = "0.17.2"
opentelemetry-jaeger = "0.16.0"
Now, in src/bin/server.rs, add the following imports:
use opentelemetry::global;
use tracing_subscriber::{
    fmt, layer::SubscriberExt, util::SubscriberInitExt,
};
We will look at what each of these do in a moment.
The next step is to replace the call to tracing_subscriber with the OTel setup.
Replace this:
tracing_subscriber::fmt::try_init()?;...with this:
// Allows you to pass along context (i.e., trace IDs) across services
global::set_text_map_propagator(opentelemetry_jaeger::Propagator::new());
// Sets up the machinery needed to export data to Jaeger
// There are other OTel crates that provide pipelines for the vendors
// mentioned earlier.
let tracer = opentelemetry_jaeger::new_pipeline()
    .with_service_name("mini-redis")
    .install_simple()?;

// Create a tracing layer with the configured tracer
let opentelemetry = tracing_opentelemetry::layer().with_tracer(tracer);

// The SubscriberExt and SubscriberInitExt traits are needed to extend the
// Registry to accept `opentelemetry (the OpenTelemetryLayer type).
tracing_subscriber::registry()
    .with(opentelemetry)
    // Continue logging to stdout
    .with(fmt::Layer::default())
.try_init()?;Now you should be able to start up mini-redis:
cargo run --bin mini-redis-serverIn another terminal, run the hello world example (this is available in the mini-redis repository):
cargo run --example hello_worldNow, refresh the Jaeger UI that we had open, and on the main Search page, find "mini-redis" as one of the options in the Service dropdown.
Select that option, and click the "Find Traces" button. This should show the request we just made from running the example. 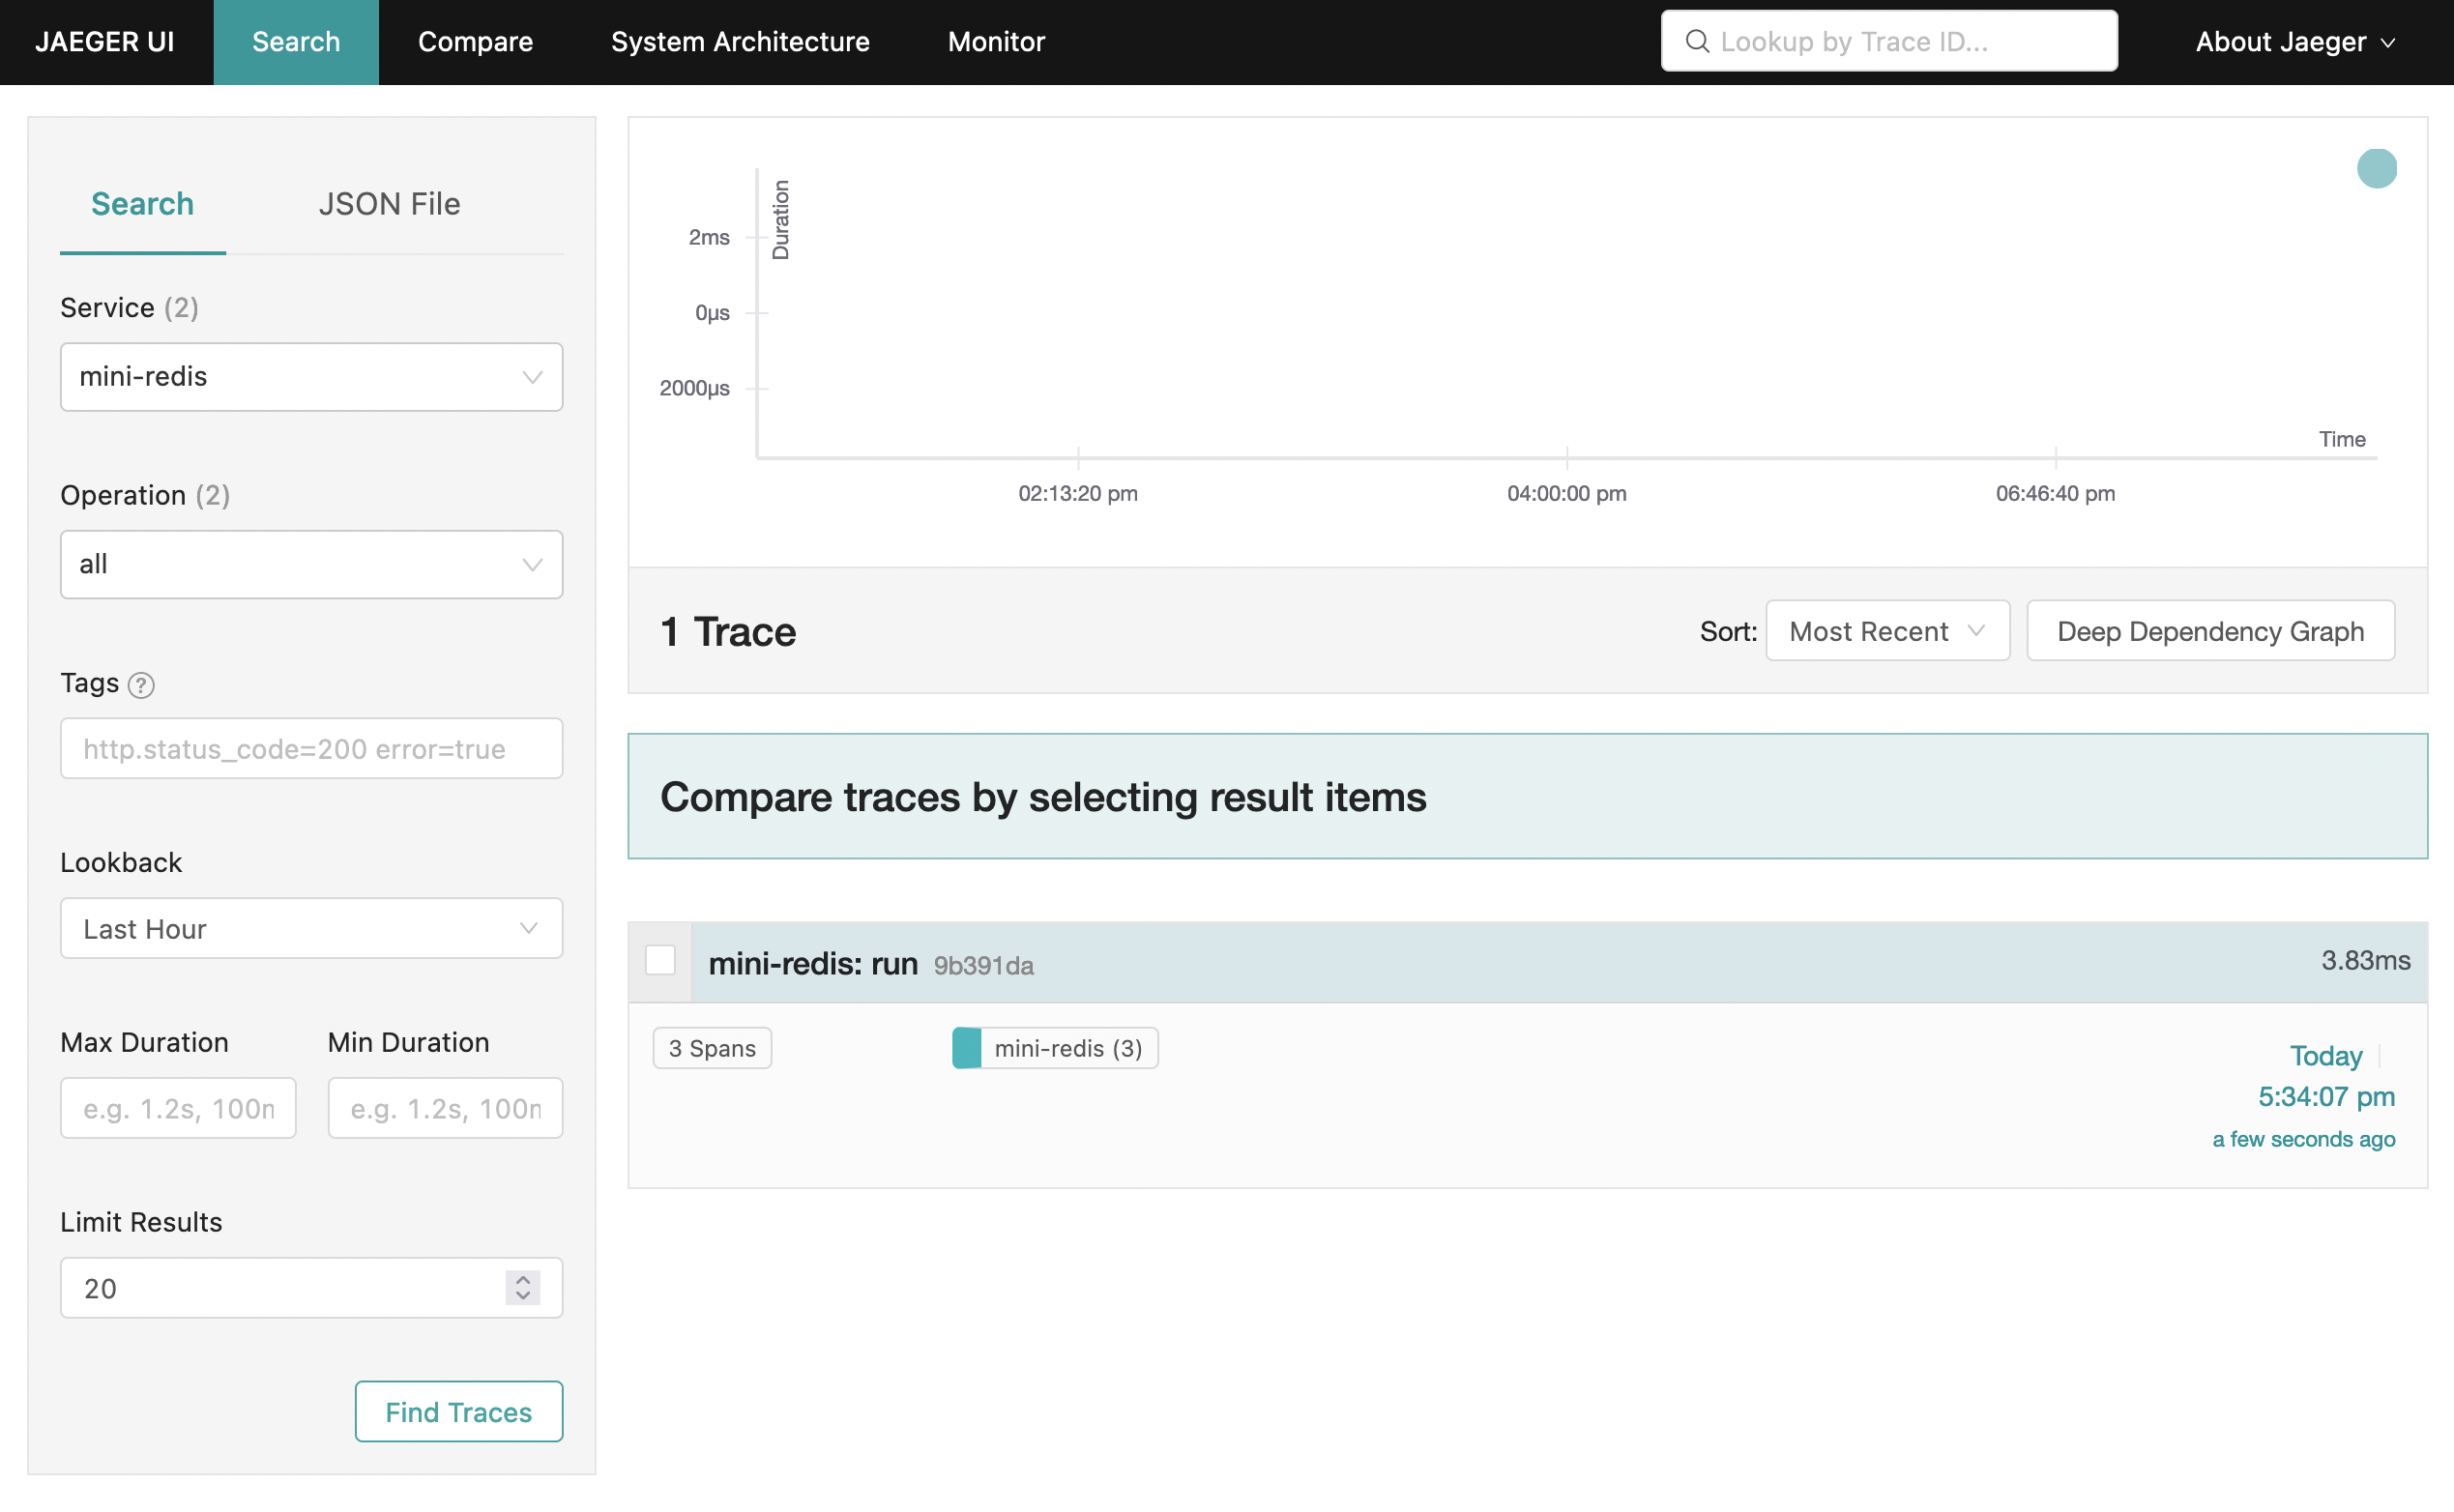
Clicking on the trace should show you a detailed view of the spans that were emitted during the handling of the hello world example. 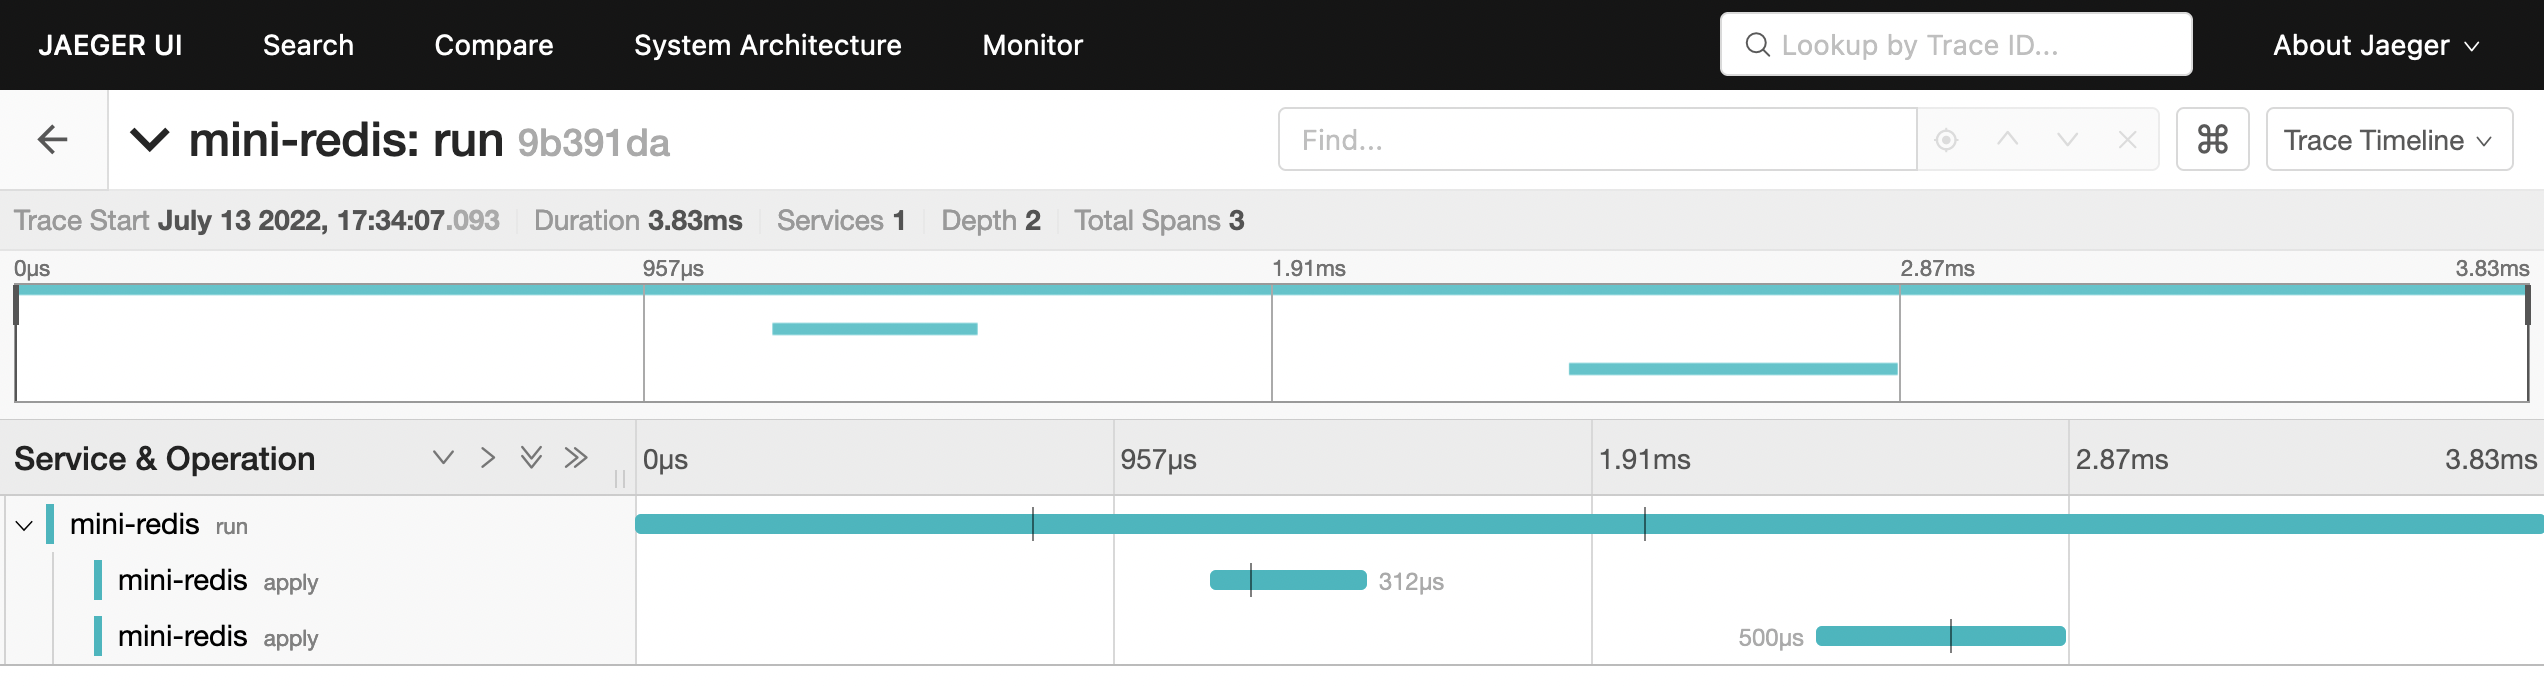
That's it for now! You can explore this further by sending more requests, adding additional instrumentation for mini-redis, or setting up OTel with a telemetry vendor (instead of the Jaeger instance we are running locally). For this last one, you might need to pull in an additional crate (for example, for sending data to the OTel Collector, you'll need the opentelemetry-otlp crate). There are many examples available in the opentelemetry-rust repository.
Note: The mini-redis repo already contains a full example of OpenTelemetry with AWS X-Ray, details of which can be found in the README, as well as the Cargo.toml and src/bin/server.rs files.
本文中的所有译文仅用于学习和交流目的,转载请务必注明文章译者、出处、和本文链接
我们的翻译工作遵照 CC 协议,如果我们的工作有侵犯到您的权益,请及时联系我们。


 关于 LearnKu


