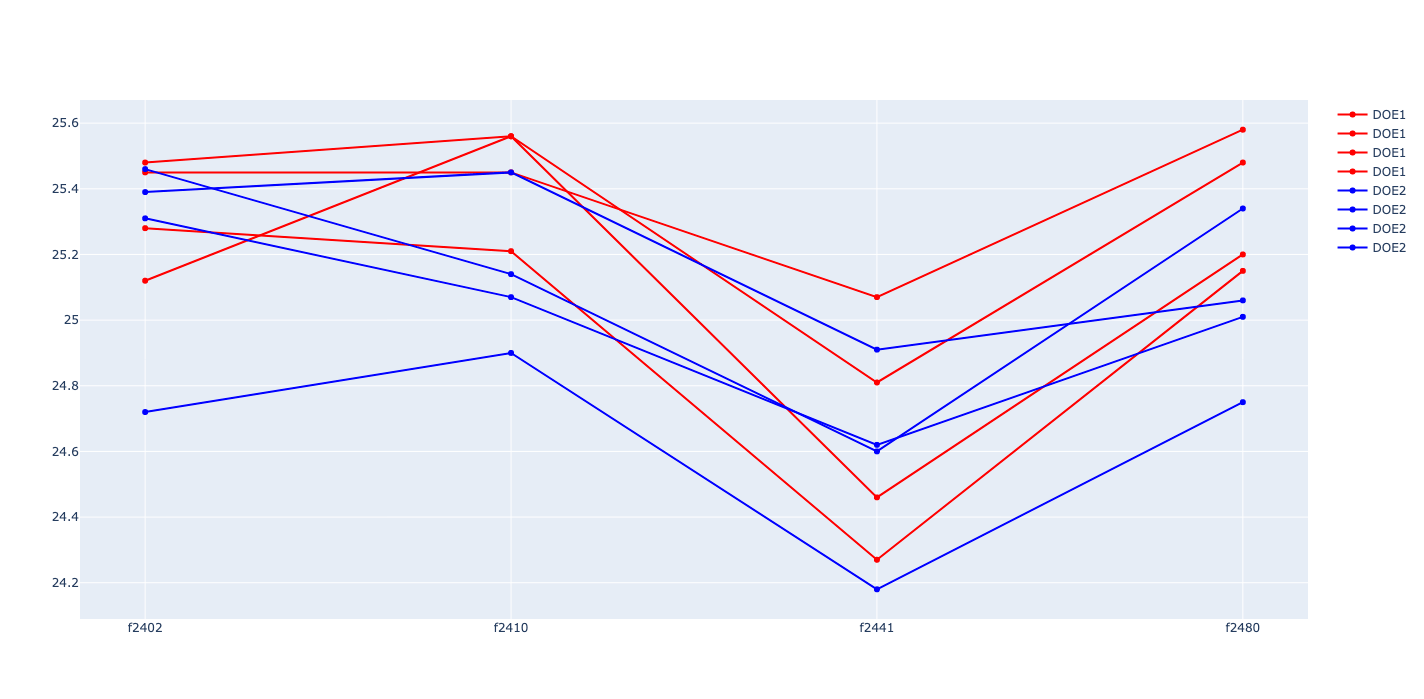
请教一个关于plotly legend的问题
最近刚学习plotly, 遇到一个问题。
如下面的代码,每个线条都有一个legend ,我怎么将相同颜色的线条标记成一个legend?
import plotly.graph_objects as go

freqList = ['f2402', 'f2410', 'f2441', 'f2480']

dataDict = {'DOE1':[[25.12, 25.56, 24.46, 25.2],
                      [25.28, 25.21, 24.27, 25.15],
                      [25.48, 25.56, 24.81, 25.48],
                      [25.45, 25.45, 25.07, 25.58]],
            'DOE2':[[25.46, 25.14, 24.6, 25.34],
                   [25.31, 25.07, 24.62, 25.01],
                   [25.39, 25.45, 24.91, 25.06],
                   [24.72, 24.9, 24.18, 24.75]]
            }


colorDict = {'DOE1': 'red',
             'DOE2':'blue'
}

fig = go.Figure()

for doe in dataDict.keys():
    for item in dataDict[doe]:
        fig.add_trace(go.Scatter(x=freqList, y=item, line=dict(color=colorDict[doe]), name=doe))

fig.show()


 关于 LearnKu


Not sure if it is ok for you.