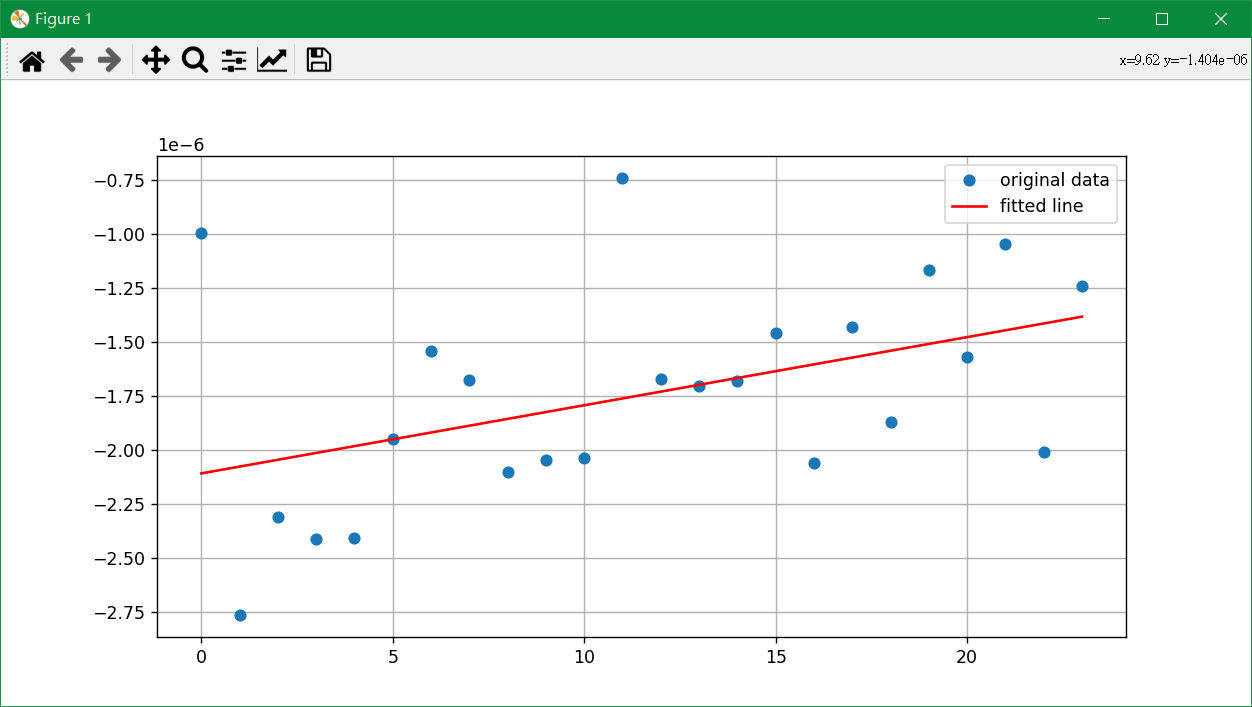
大佬们有没有程序可以对一组数据进行预测,趋势是走向0的
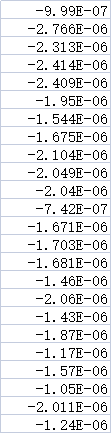
对一组数据进行预测
| -9.99E-07 |
| -2.766E-06 |
| -2.313E-06 |
| -2.414E-06 |
| -2.409E-06 |
| -1.95E-06 |
| -1.544E-06 |
| -1.675E-06 |
| -2.104E-06 |
| -2.049E-06 |
| -2.04E-06 |
| -7.42E-07 |
| -1.671E-06 |
| -1.703E-06 |
| -1.681E-06 |
| -1.46E-06 |
| -2.06E-06 |
| -1.43E-06 |
| -1.87E-06 |
| -1.17E-06 |
| -1.57E-06 |
| -1.05E-06 |
| -2.011E-06 |
| -1.24E-06 |

讨论数量: 1
Jason990420
import numpy as np
import matplotlib.pyplot as plt
from scipy.stats import linregress

y = np.array([
    -9.990E-07, -2.766E-06, -2.313E-06, -2.414E-06, -2.409E-06, -1.95E-06,
    -1.544E-06, -1.675E-06, -2.104E-06, -2.049E-06, -2.040E-06, -7.42E-07,
    -1.671E-06, -1.703E-06, -1.681E-06, -1.460E-06, -2.060E-06, -1.43E-06,
    -1.870E-06, -1.170E-06, -1.570E-06, -1.050E-06, -2.011E-06, -1.24E-06,
])
x = np.array([i for i in range(len(y))])
slope, intercept, r_value, p_value, std_err = linregress(x, y)

plt.figure(figsize=(10, 5))
plt.plot(x, y, 'o', label='original data')
plt.plot(x, intercept + slope*x, 'r', label='fitted line')
plt.legend()
plt.grid()
plt.show()

file

9个月前 评论

讨论应以学习和精进为目的。请勿发布不友善或者负能量的内容,与人为善,比聪明更重要!