
可以帮我运行一下这个代码吗?我运行出来的表格是空白的,三线图上什么都没有,检查之后说的是没有找到excel文件
import pandas as pd
import matplotlib.pyplot as plt
读取数据文件
data = pd.read_excel(“中芯国际财务报告.xlsx”)
提取年份和财务数据
years = data[“年份(年)”]
net_profit = data[“净利润”]
operating_income = data[“营业收入”]
total_assets = data[“资产总额”]
total_liabilities = data[“负债总额”]
current_assets = data[“流动资产”]
current_liabilities = data[“流动负债”]
cash_and_cash_equivalents = data[“现金及现金等价物”]
计算关键财务比率
net_profit_margin = net_profit / operating_income * 100
return_on_equity = net_profit / (total_assets - total_liabilities) * 100
debt_to_asset_ratio = total_liabilities / total_assets * 100
current_ratio = current_assets / current_liabilities
cash_ratio = cash_and_cash_equivalents / current_liabilities
绘制图表
plt.figure(figsize=(12, 8))
净利润率
plt.subplot(3, 2, 1)
plt.plot(years, net_profit_margin)
plt.xlabel(“年份”)
plt.ylabel(“净利润率”)
plt.title(“净利润率变化趋势”)
净资产收益率
plt.subplot(3, 2, 2)
plt.plot(years, return_on_equity)
plt.xlabel(“年份”)
plt.ylabel(“净资产收益率”)
plt.title(“净资产收益率变化趋势”)
资产负债率
plt.subplot(3, 2, 3)
plt.plot(years, debt_to_asset_ratio)
plt.xlabel(“年份”)
plt.ylabel(“资产负债率”)
plt.title(“资产负债率变化趋势”)
流动比率
plt.subplot(3, 2, 4)
plt.plot(years, current_ratio)
plt.xlabel(“年份”)
plt.ylabel(“流动比率”)
plt.title(“流动比率变化趋势”)
现金比率
plt.subplot(3, 2, 5)
plt.plot(years, cash_ratio)
plt.xlabel(“年份”)
plt.ylabel(“现金比率”)
plt.title(“现金比率变化趋势”)
调整布局
plt.tight_layout()
显示图表
plt.show()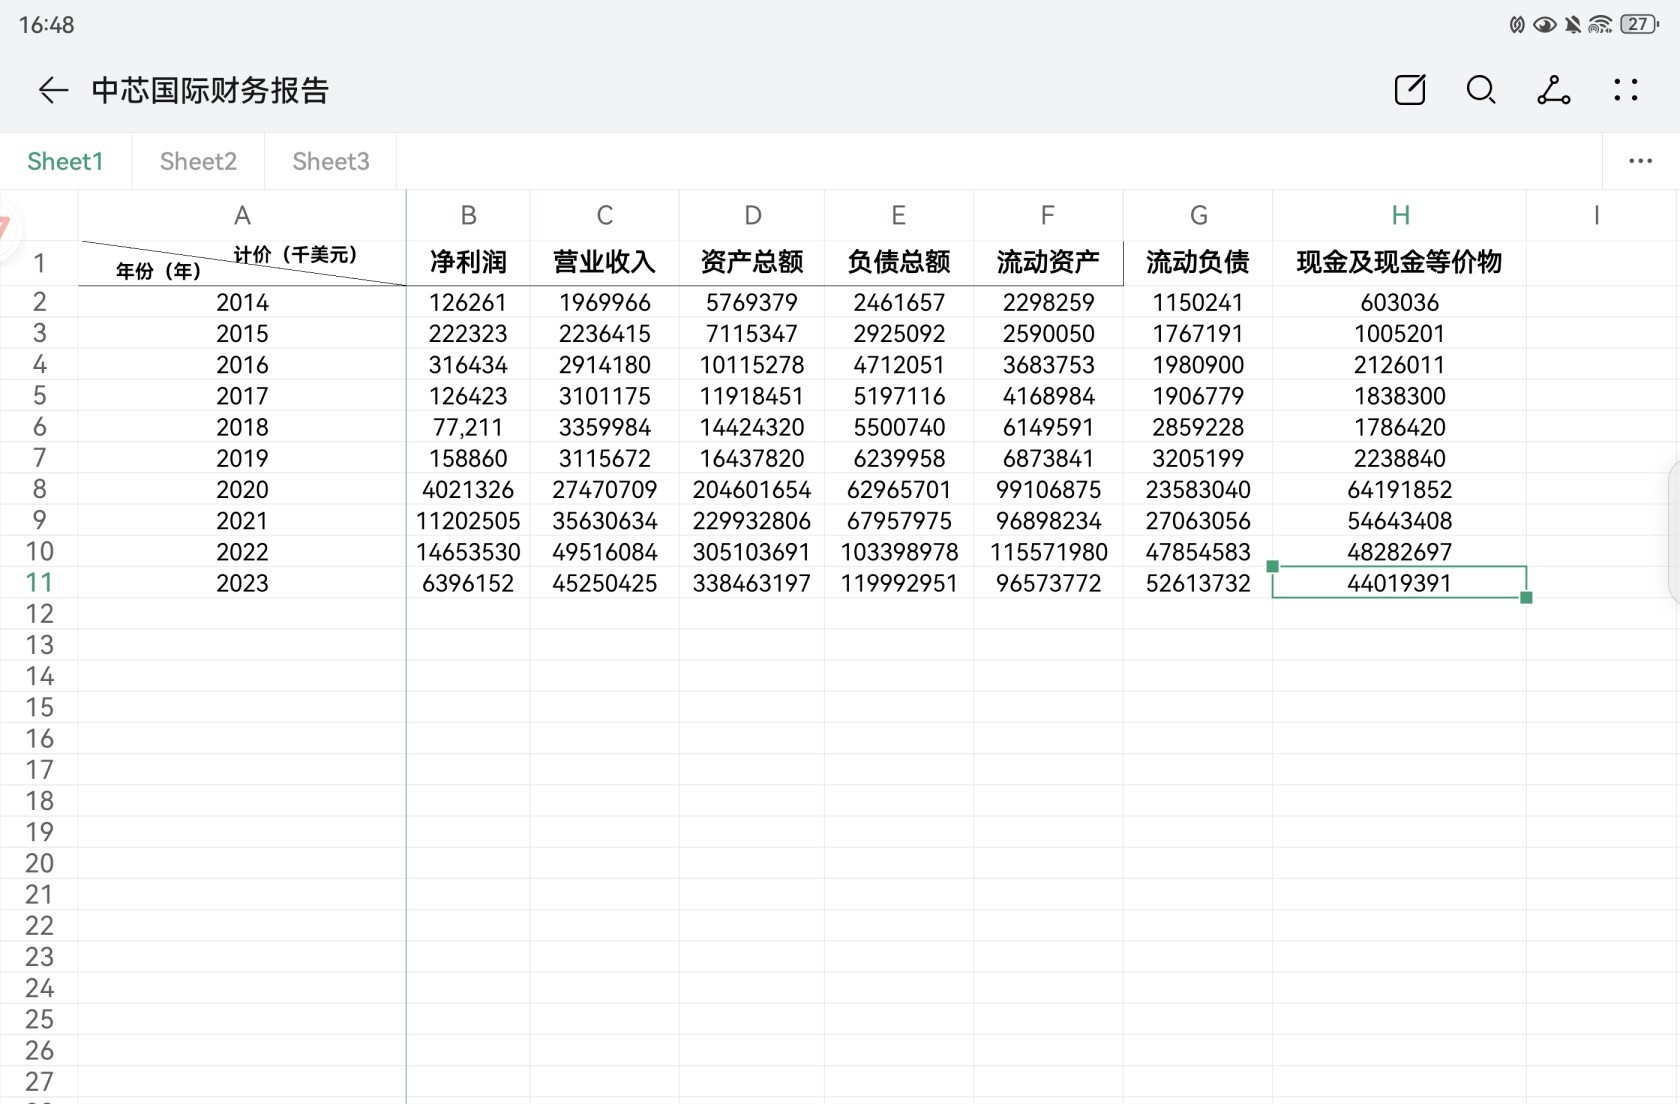 这个是excel文档的图片
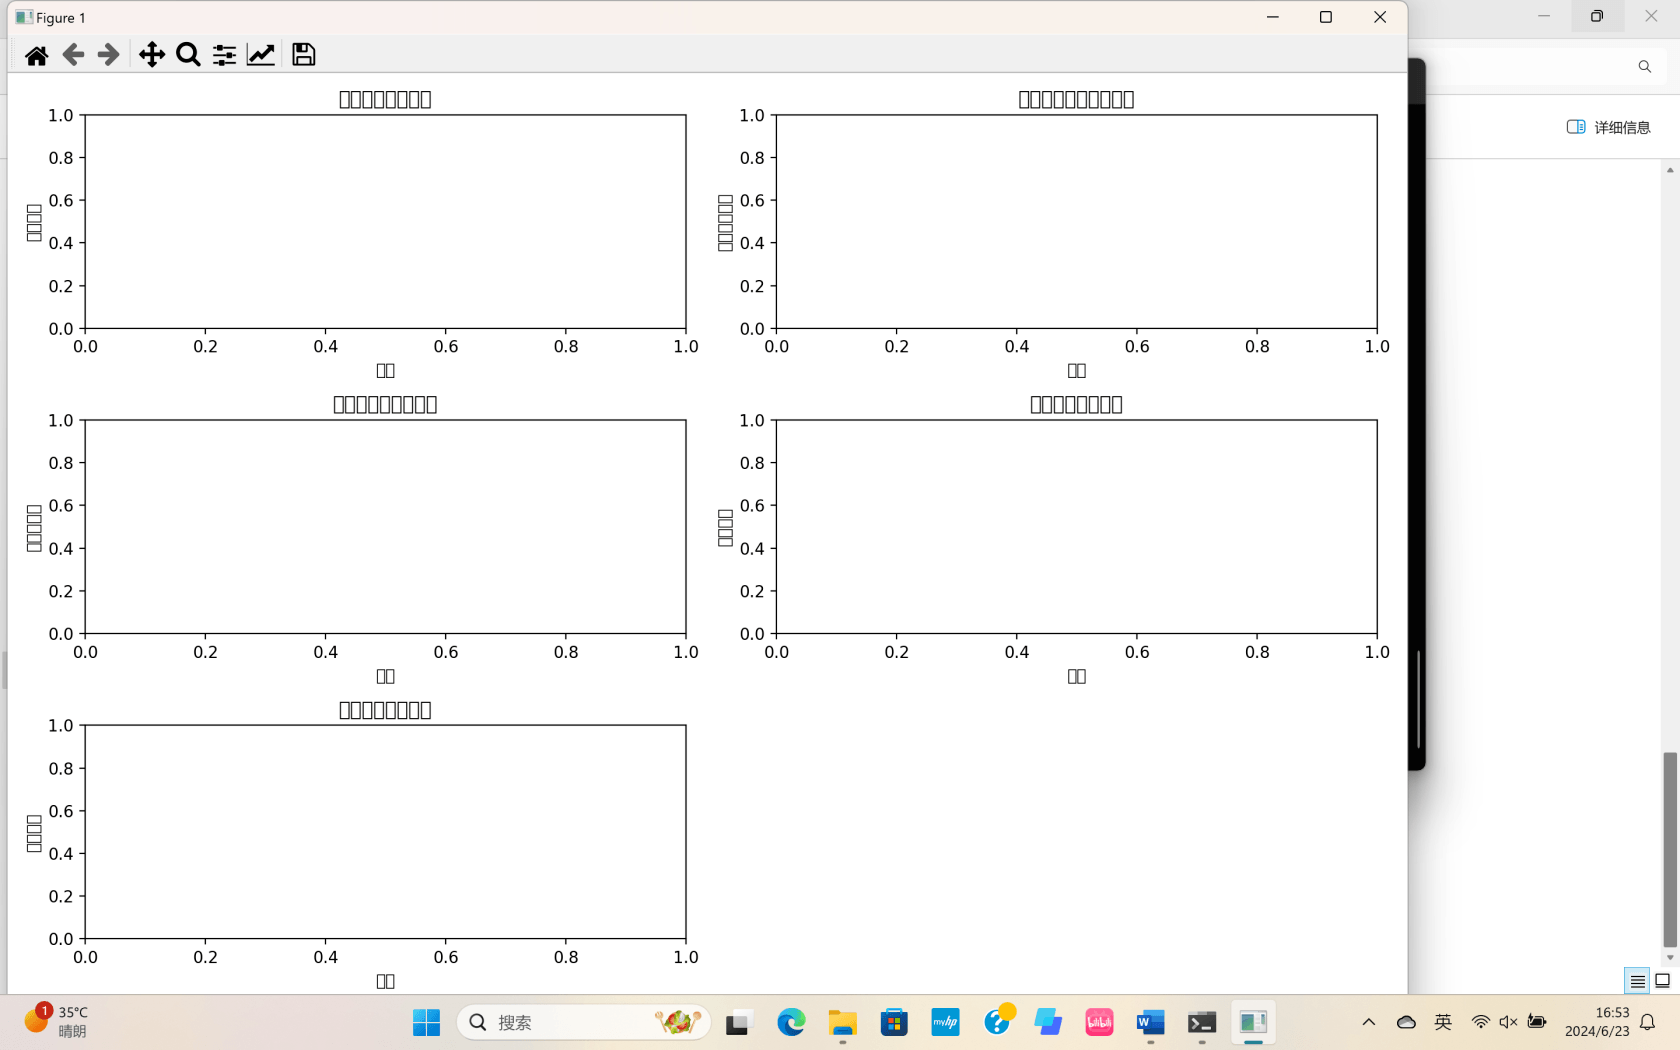 这个是我运行出来的结果


 关于 LearnKu


推荐文章: