
基于 Laradock 在 PHPStorm 和 VS Code 下使用 Xdebug (Mac 篇)
12 / 2 / 创建于 7年前
 coding01 的个人博客
写代码总绕不过需要调试,除了 UnitTest 外,我们还是需要借助 Xdebug 进行调试。
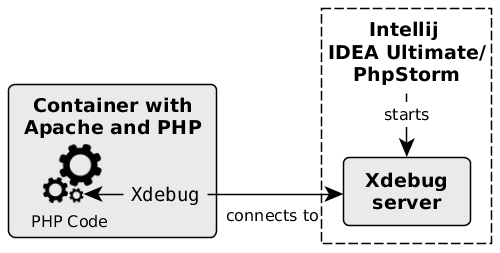
所以今天来说说如何基于本地 Docker 环境下,使用 Xdebug。
这里的使用,是分别整合到 VS Code 和 PHPStorm 下。
安装 Xdebug
还是基于神级武器 —— Laradock。我们先看看 Laradock 官网是怎么安装 Xdebug。
Install xDebug#
1 - First install xDebug in the Workspace and the PHP-FPM Containers:
a) open the .env file
b) search for the WORKSPACE_INSTALL_XDEBUG argument under the Workspace Container
c) set it to true
d) search for the PHP_FPM_INSTALL_XDEBUG argument under the PHP-FPM Container
e) set it to true2 - Re-build the containers docker-compose build workspace php-fpm
我们修改对应的地方,然后 build,如果出现下面的错误提示:
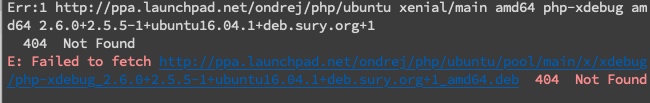
尝试添加国内源试试:
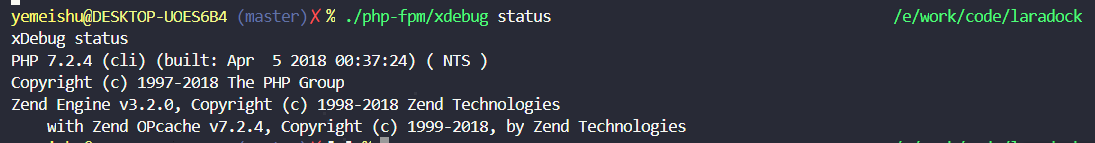
RUN sed -i s@/archive.ubuntu.com/@/mirrors.aliyun.com/@g /etc/apt/sources.list重新 docker-compose up -d nginx 后,在 Windows / Mac 下用命令 ./php-fpm/xdebug status 查看安装状态:
配置 Xdebug
目前开发使用 IDE,个人觉得普遍用的最多的就是 VS Code 和 PHPStorm。所以下面就利用这两个 IDE,分别说说如何使用 Xdebug 的。
VS Code
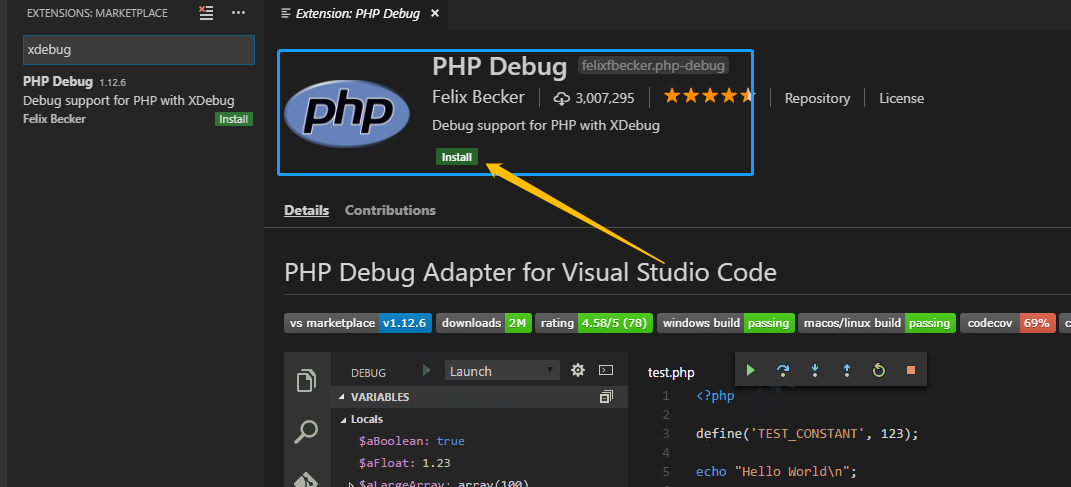
在 VS Code 下,如果没安装 Xdebug 插件,直接搜索安装即可:
安装后,增加 Xdebug 环境配置:
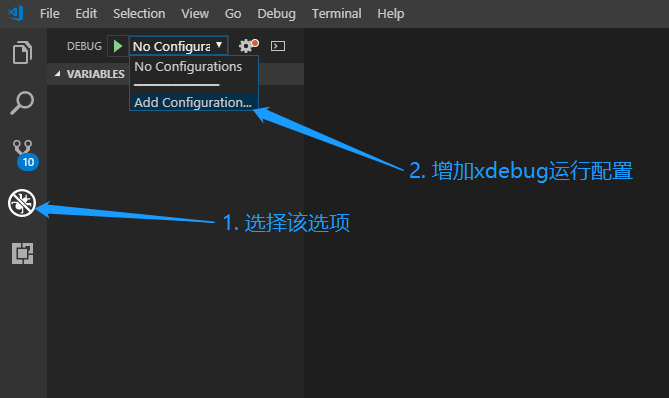
这样就会项目的 .vscode 文件夹下多了一个 Xdebug 配置文件 launch.json,我们配置端口号与 php-fpm 下的 Xdebug 一致,我们再配置 pathMappings 让 docker 下的项目路径与本地项目路径关联。具体如下:
{
"version": "0.2.0",
"configurations": [
{
"name": "XDebug listening to Laradock",
"log": true,
"type": "php",
"request": "launch",
"port": 9000,
"pathMappings": {
"/var/www/myrss": "${workspaceFolder}",
}
},
{
"name": "Launch currently open script",
"type": "php",
"request": "launch",
"program": "${file}",
"cwd": "${fileDirname}",
"port": 9000
}
]
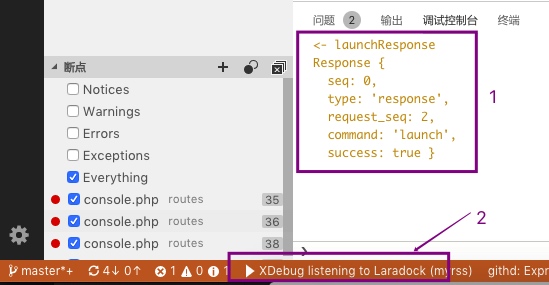
}好了,我们启动 XDebug,打印出如下内容,即表示等待请求:
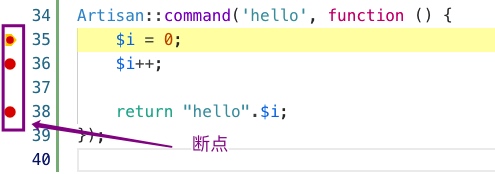
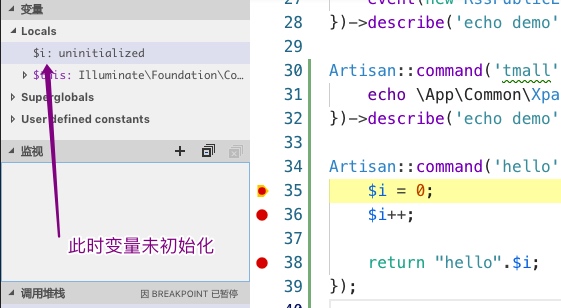
我们写个 Demo,并设置断点:
Artisan::command('hello', function () {
    $i = 0;
    $i++;

    return "hello".$i;
});
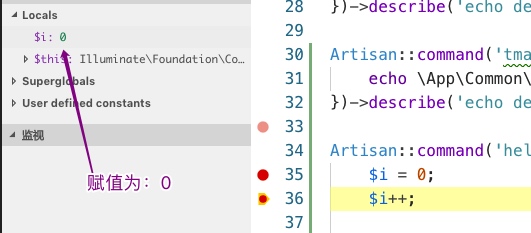
然后启动 Xdebug,并执行命令:
php artisan hello我们可以看到很多输入、输出、断点等信息: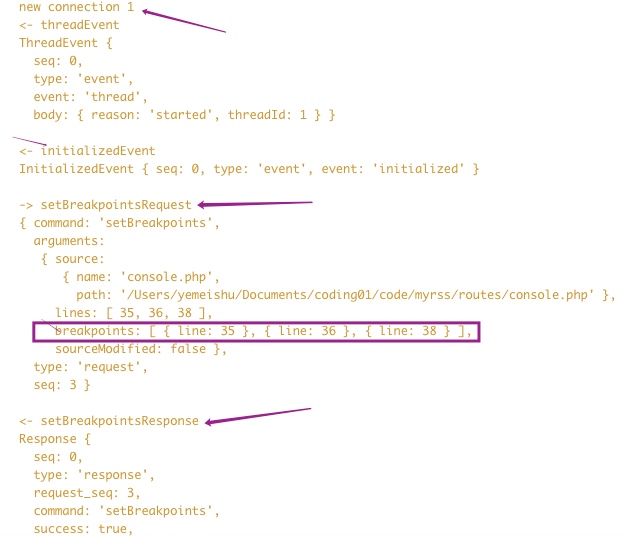
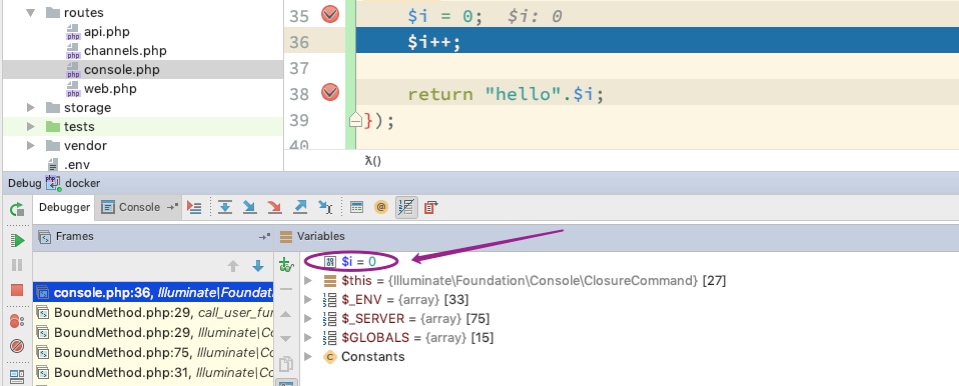
其中我们也能看到此时的变量 $i 处于未初始状态:
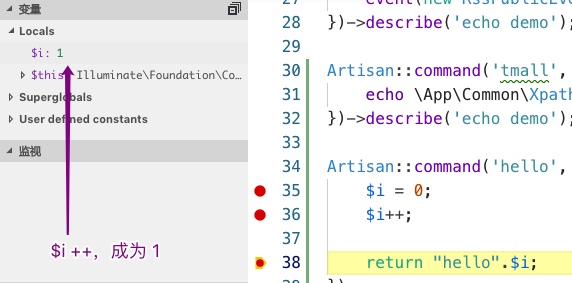
我们在这断点继续往下执行:
PHPStorm
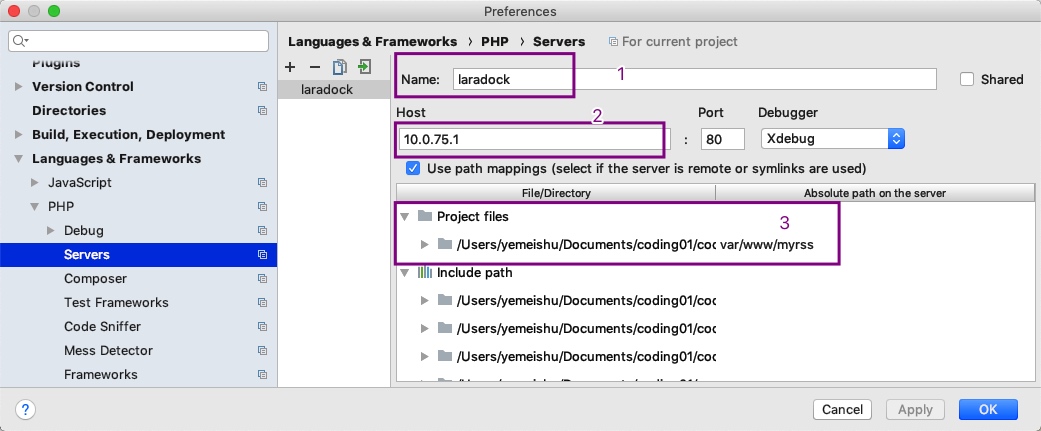
在 Mac 或者 Windows 10 下 Docker 的默认 ip 为:10.0.75.1,
我们先增加一个 Server,其中:
- Name:laradock
- Host: 10.0.75.1
- mappings,等同于上文 VS Code 配置的 pathMappings
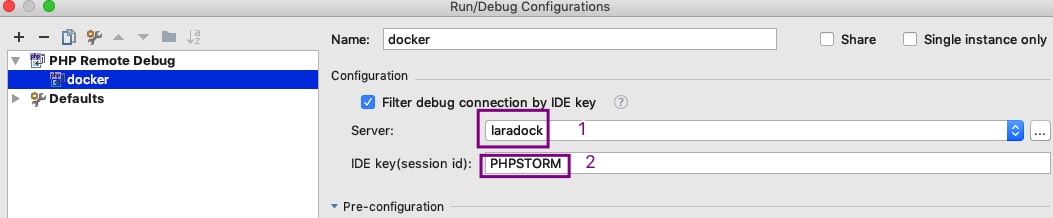
然后,可以新建 PHP Remote Debug,其中:
- Server:关联到我们上面建的 laradock
- IDE key:和 Laradock‘s php-fpm 中配置的保持一致即可
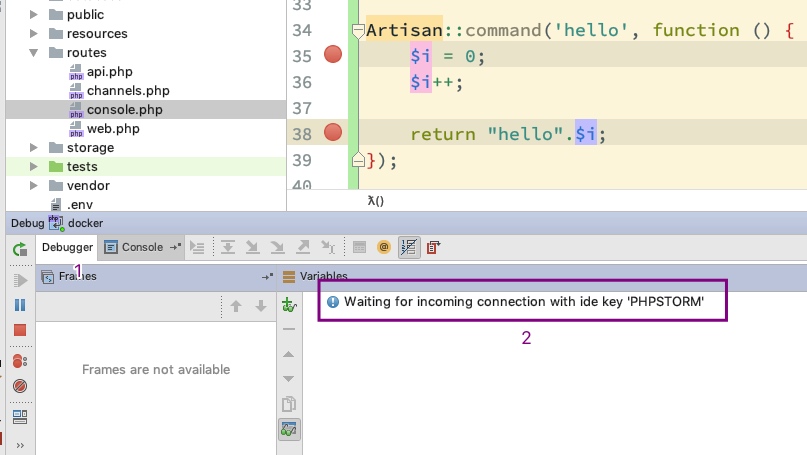
好了,我们可以使用 demo,创建断点,运行 Debug 等待请求::
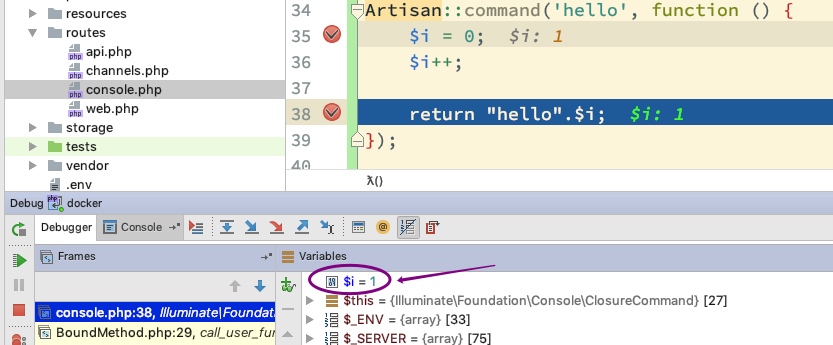
一样的,执行命令:php artisan hello:
我们继续往下走:
总结
用好 Xdebug,更加直观的了解方法中每个变量的动态变化,能提高我们跟踪和排查代码的问题所在。至于下一步如何更好的使用 Xdebug,就看各自的实际项目和开发需要了。
参考
Setting up xDebug with PHPUnit using Docker for Mac and PHPStorm https://intellij-support.jetbrains.com/hc/...
Laradock + XDebug + MS Code? No problem https://medium.com/full-stack-development/...
Laradock的xdebug在vscode上使用的配置 https://www.itread01.com/content/152627893...
如何設定VSCode XDebug在laradock環境上 https://blog.scottchayaa.com/post/2018/10/...
本作品采用《CC 协议》,转载必须注明作者和本文链接


 关于 LearnKu


推荐文章: