
Go 语言性能分析
0 / 2 / 创建于 6年前
 pibigstar 的个人博客
1. 准备工作
1.1 下载go-wrk
这个是用来进行http接口压测的
官网地址:https://github.com/tsliwowicz/go-wrk
七牛云下载
使用
go-wrk -d 500 http://localhost:8080/hello1.2 安装生成火焰图工具
1.2.1 下载go-torch
go get github.com/uber/go-torch1.2.2 安装perl
官网下载地址:https://www.activestate.com/products/perl/...
七牛云下载注意:安装时记得把添加到环境变量PATH选项勾上
1.2.3 下载FlameGraph
git clone https://github.com/brendangregg/FlameGraph.git注意:将此文件夹加入到PATH环境变量中
1.3 下载graphviz
生成SVG 图,能够更好地看到函数调用 CPU 占用情况
1.3.1 Windows安装
官网下载地址:https://graphviz.gitlab.io/_pages/Download...
七牛云下载
安装好之后,添加其 bin文件到PATH环境变量中
1.3.2 Linux安装
# Ubuntu
sudo apt-get install graphviz

# Centos
yum install graphviz
1.3.3 测试
检查是否安装成功
dot -version
2. 性能分析
2.1 开启性能分析
开启性能分析只需要导入下面这个包即可
import _ "net/http/pprof"2.2 开始压测
代码见文章末尾附录
- 启动
main.go - 开始压测
go-wrk -d 500 http://localhost:8080/hello
2.3 web查看
浏览器打开:http://localhost:8080/debug/pprof/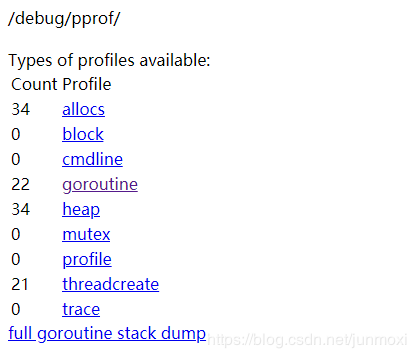
allocs: 内存分配情况block: 导致阻塞同步的堆栈跟踪cmdline: 当前程序激活的命令行goroutine: 当前运行的goroutineheap: 存活对象的内存分配情况mutex: 互斥锁的竞争持有者的堆栈跟踪profile: 默认进行 30s 的 CPU Profilingthreadcreate: 操作系统线程跟踪trace: 当前程序执行情况full goroutine stack dump: 所有goroutine栈输出2.4 采样分析
下面命令会打开一个交互页面
go tool pprof --seconds 5 http://localhost:8080/debug/pprof/profile常用命令
top默认显示 10 个占用 CPU 时间最多的函数tree树形结构查看goroutine情况。web生成SVG函数调用图(需安装graphviz)exit退出分析
打开pprof可视化页面,与上面 可交互页面中web命令效果一样
go tool pprof -http=:8080 http://localhost:8080/debug/pprof/profile?seconds=60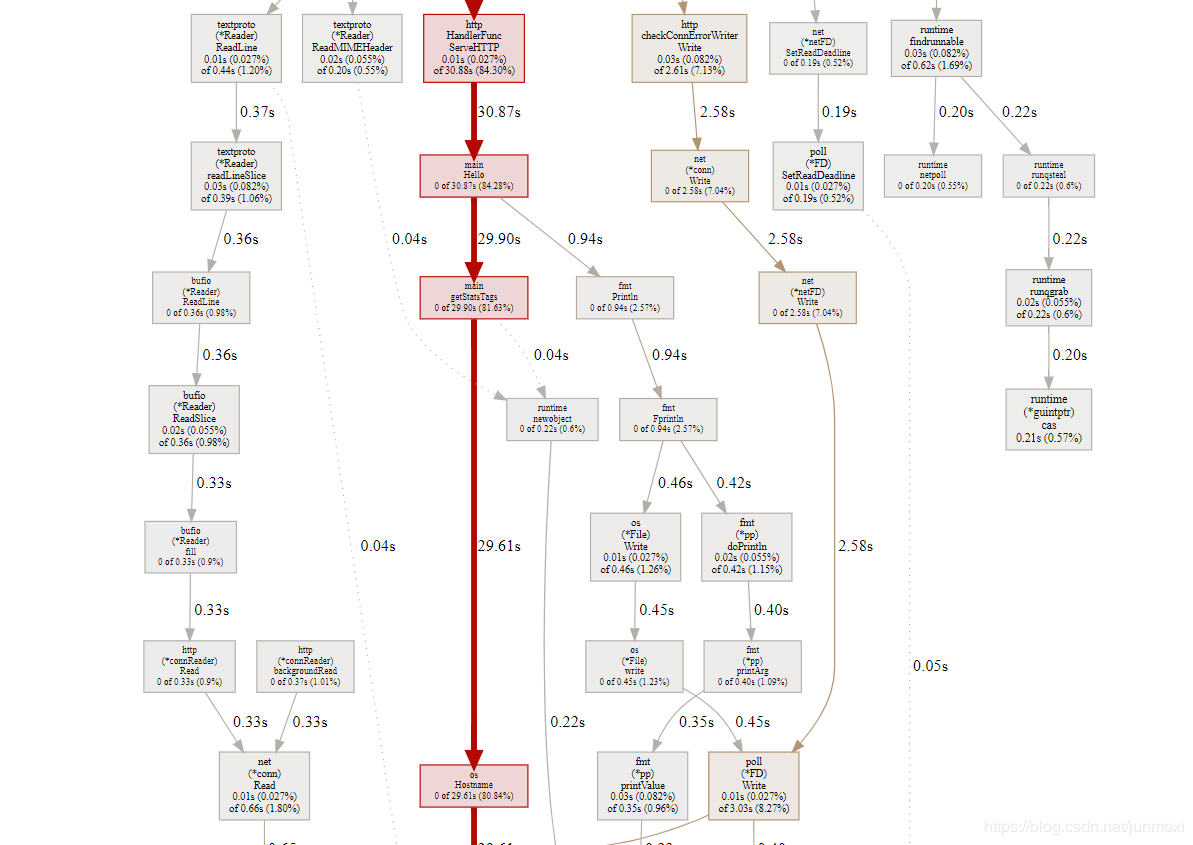
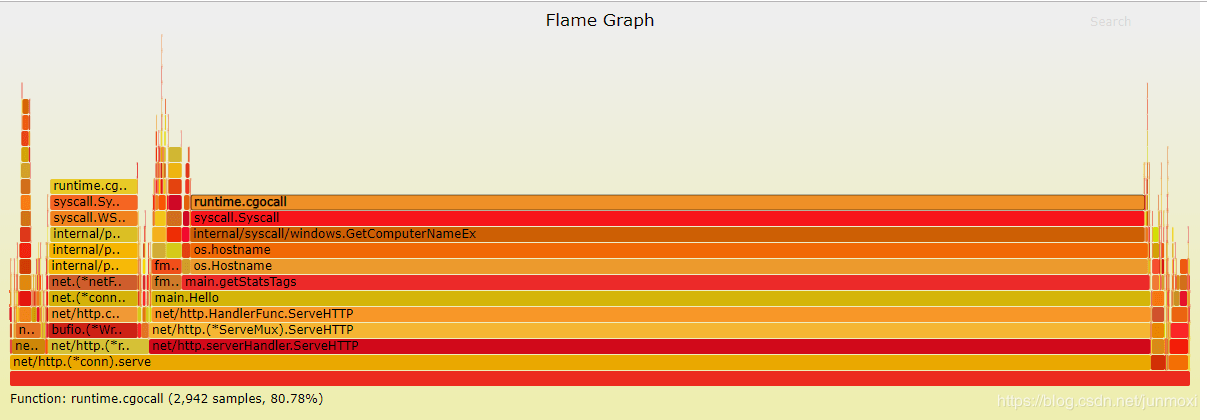
2.5 生成火焰图
进行 5 秒钟的 CPU 性能采样并生成火焰图
go-torch --seconds 5 http://localhost:8080/debug/pprof/profile命令执行完会在该目录下生成一个
torch.svg文件,可用浏览器打开查看火焰图3. Go压力测试分析
- 生成
pprof.cpu文件go test -bench . -benchmem -cpuprofile pprof.cpu- 分析
pprof.cpu文件go tool pprof pprof.cpu
代码
https://github.com/pibigstar/go-demo/tree/...
本作品采用《CC 协议》,转载必须注明作者和本文链接


 关于 LearnKu


七牛链接挂了 http://store.pibigstar.com/go-wrk.exe
@lovecn 呃,我换域名解析了,已经重新换回来了,现在可以下了