
Windows、Laradock、PHPStorm、VSCode、xDebug
4 / 1 / 创建于 5年前 /
 LaraMQ 的个人博客
1. Laradock 安装 xDebug
先附上原文链接:Install xDebug
懒得看原文链接可以看这里:
编辑 laradock 目录下 .env 文件,修改以下两项
.
.
.
WORKSPACE_INSTALL_XDEBUG=true
.
PHP_FPM_INSTALL_XDEBUG=true
.
.
.
编辑 laradock/workspace/xdebug.ini 和 laradock/php-fpm/xdebug.ini,具体配置如下
 xdebug.remote_host=docker.for.win.localhost
 xdebug.remote_connect_back=0
 xdebug.remote_port=9009
 xdebug.idekey=PHPSTORM

 xdebug.remote_autostart=0
 xdebug.remote_enable=0
 xdebug.cli_color=0
 xdebug.profiler_enable=0
 xdebug.profiler_output_dir="~/xdebug/phpstorm/tmp/profiling"

 xdebug.remote_handler=dbgp
 xdebug.remote_mode=req

 xdebug.var_display_max_children=-1
 xdebug.var_display_max_data=-1
 xdebug.var_display_max_depth=-1
需要注意两个变量
 xdebug.remote_host=docker.for.win.localhost
 xdebug.remote_port=9009
xdebug.remote_host 如果是 mac 则换成 docker.for.mac.localhost
xdebug.remote_port 是容器映射宿主机的端口,如果被占用请自行更换成可用端口
其他的变量照抄就好重新构建镜像
docker-compose build php-fpm workspace构建完成后,在 laradock 目录下打开终端,使用以下命令验证 xDebug 是否已安装成功、启动、关闭(这里建议使用 git bash ,我使用 cmd 报错找不到命令,使用 git bash 就正常执行了)。
启动:./php-fpm/xdebug start关闭:
./php-fpm/xdebug stop查看状态:
./php-fpm/xdebug status以上做完后我们就可以开始配置 PHPStorm 或者 VSCode 来 debug 了。
2. PHPStorm 配置与使用
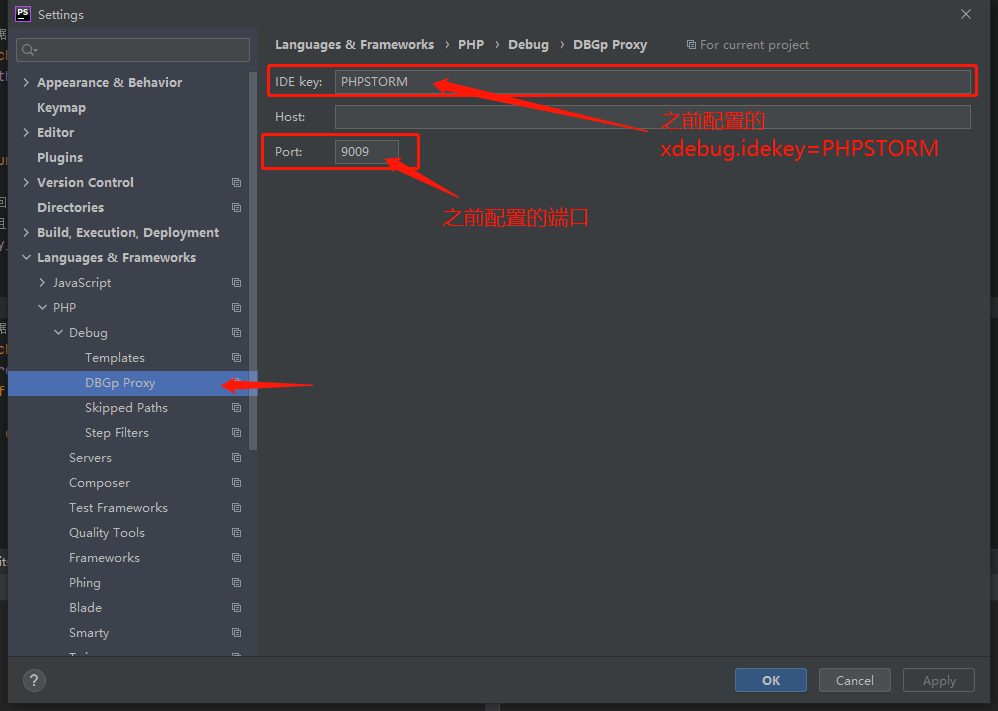
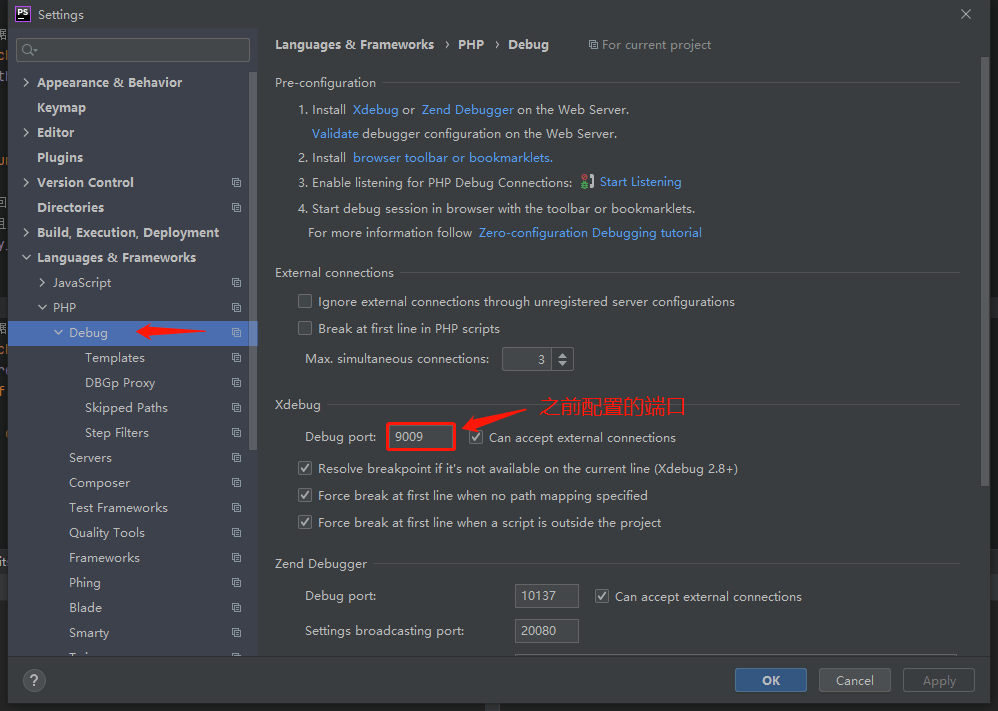
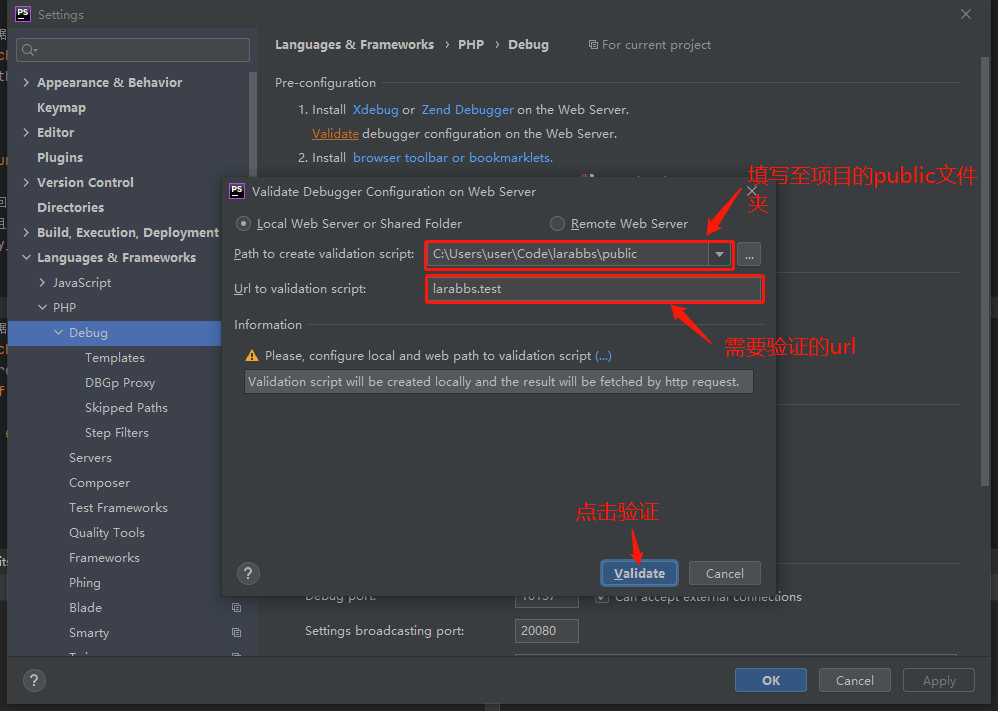
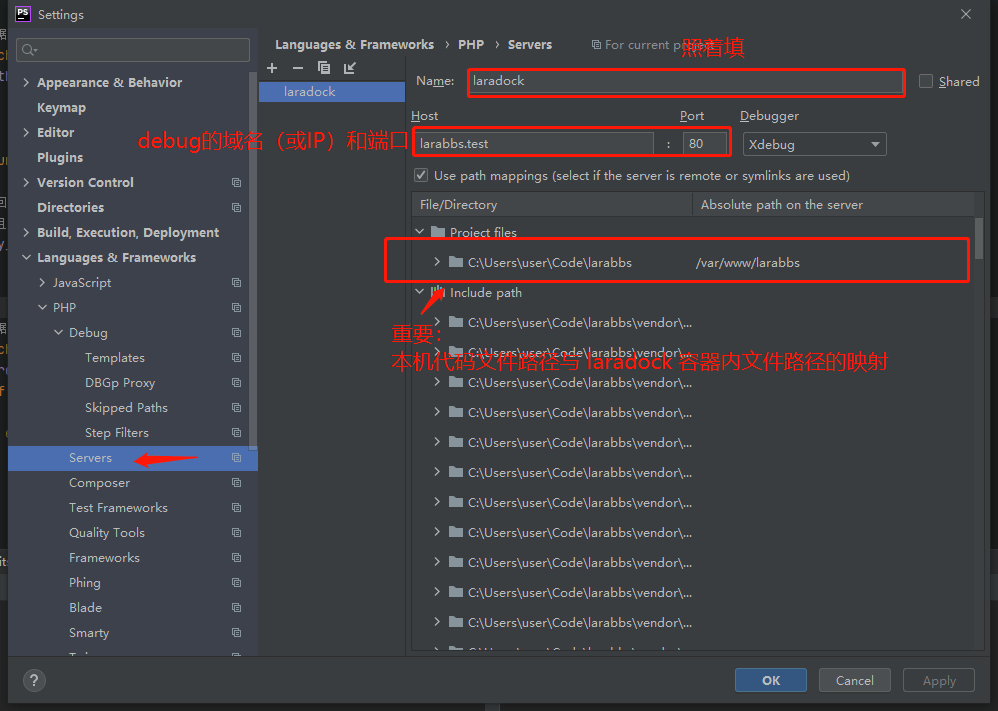
2.1 配置
直接上图: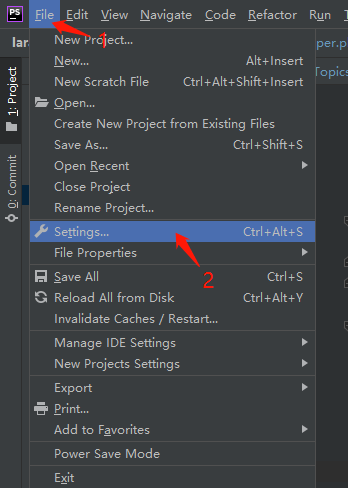
上述做完后验证一下是否成功:
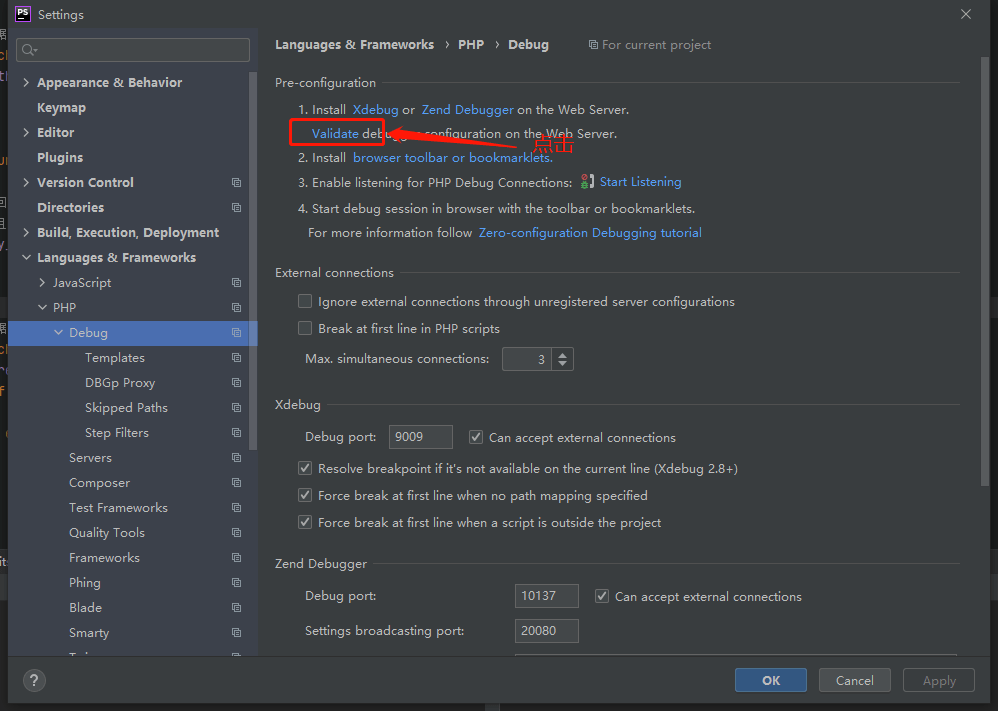
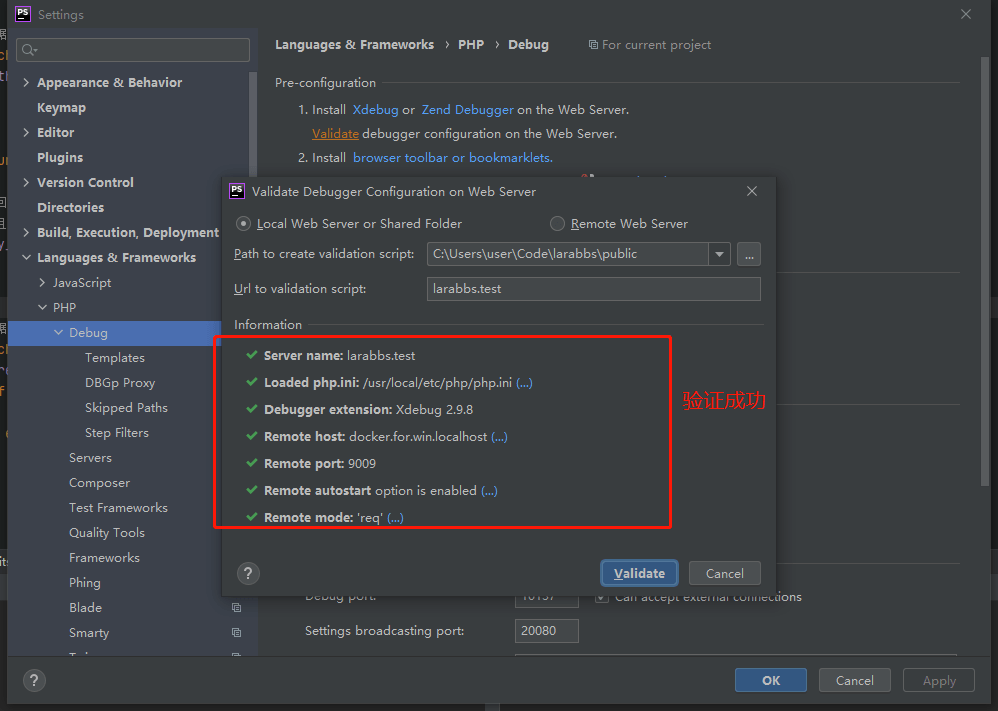
至此配置完成,接下来我们测试一下是否可以成功 debug 。
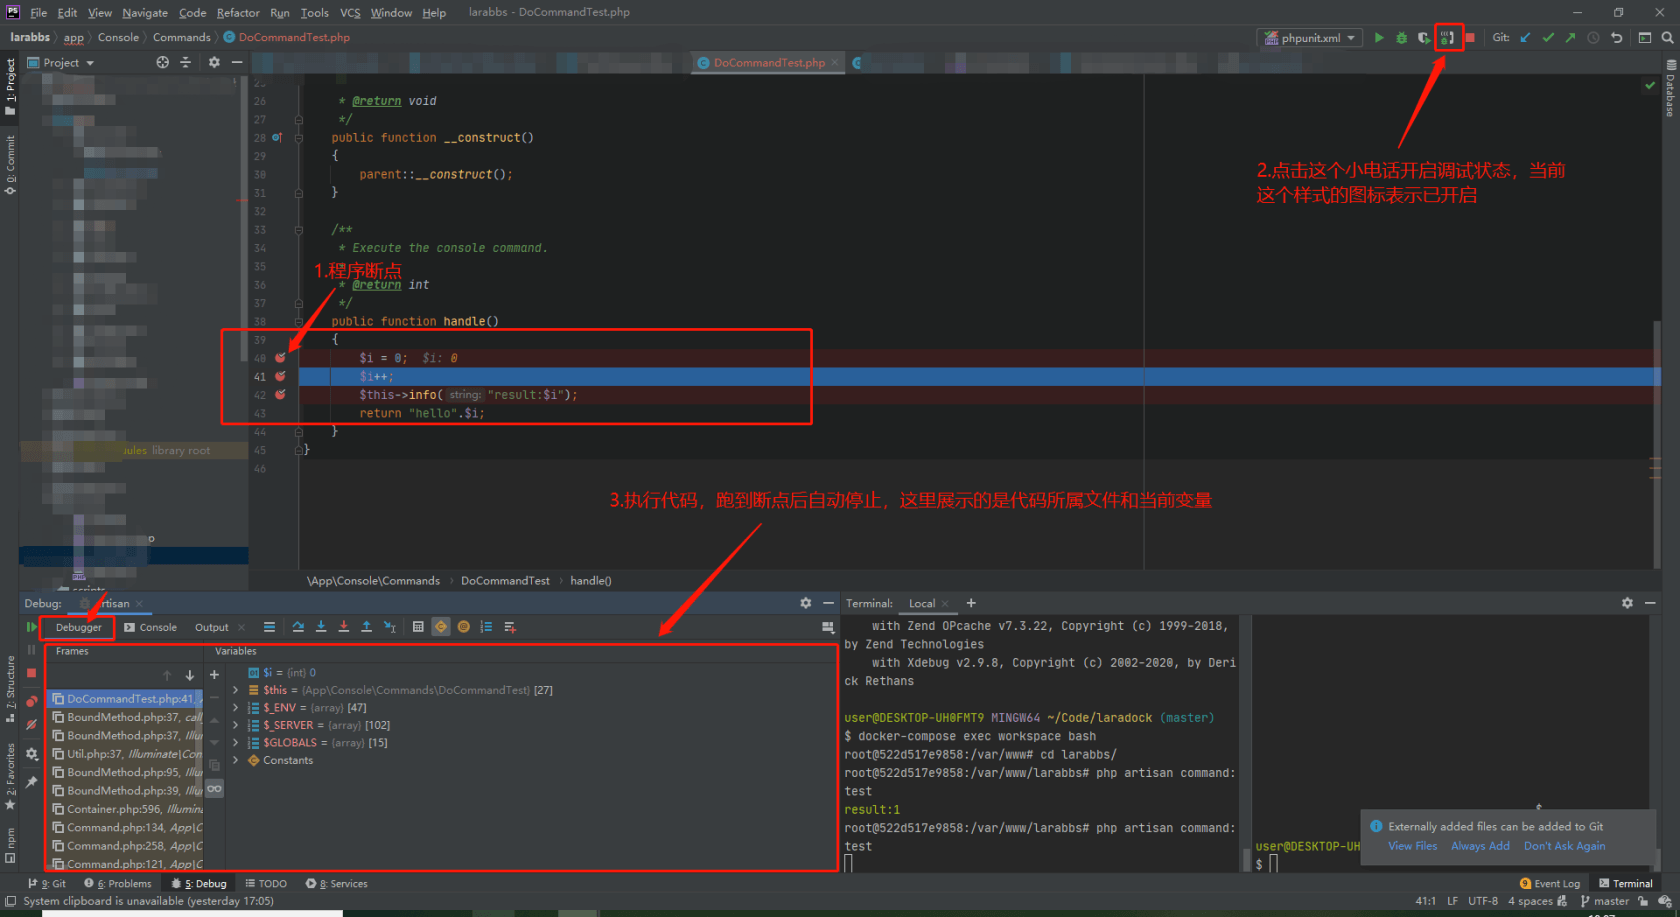
2.2 如何使用
在你的项目代码中打上断点,点击右上角的小电话,执行代码,你就可以看到如下图 debug 界面。
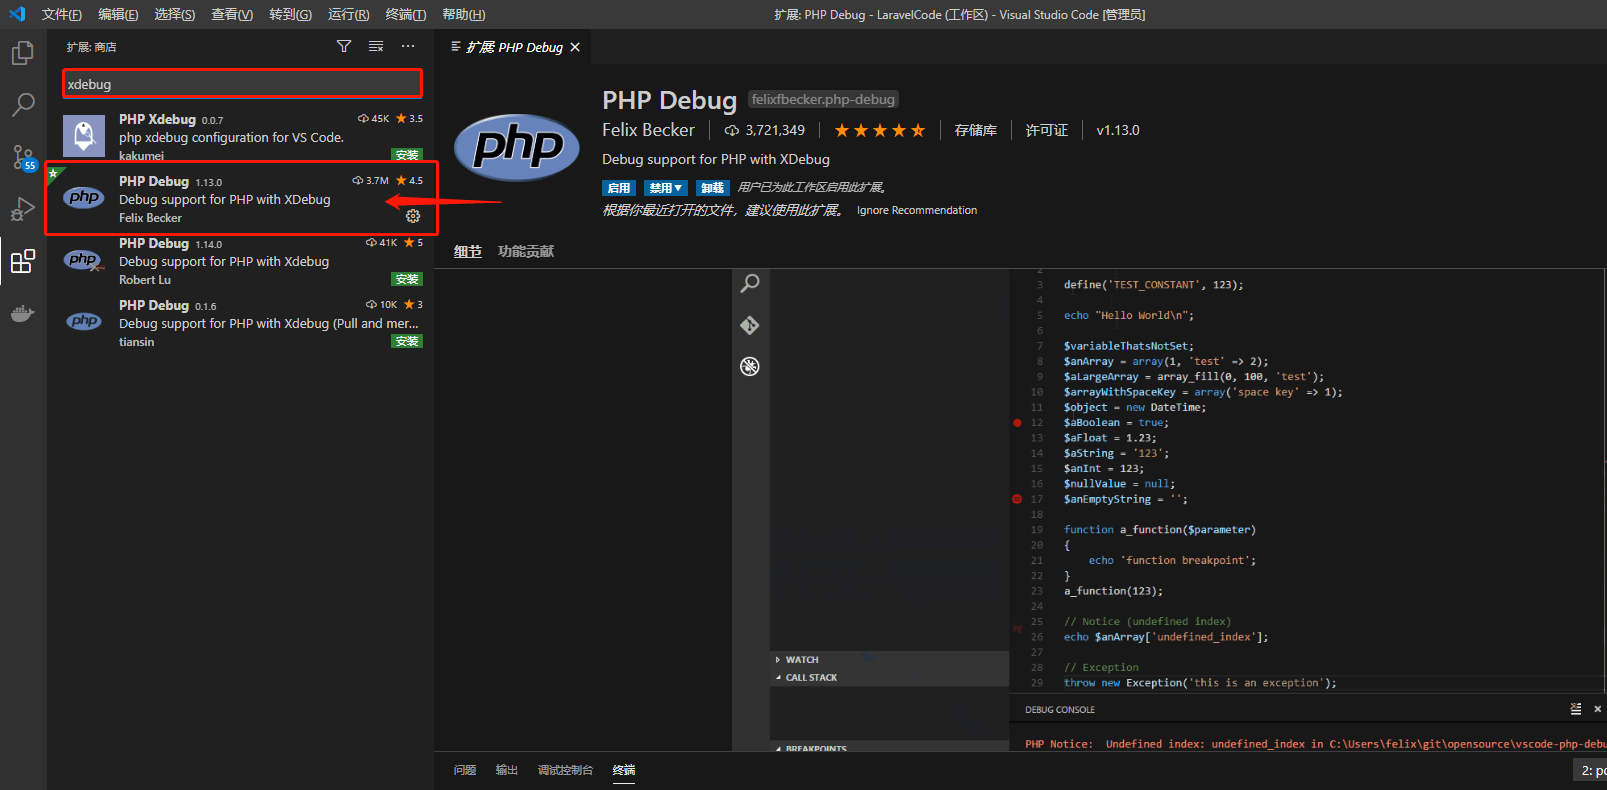
3. VSCode 配置与使用
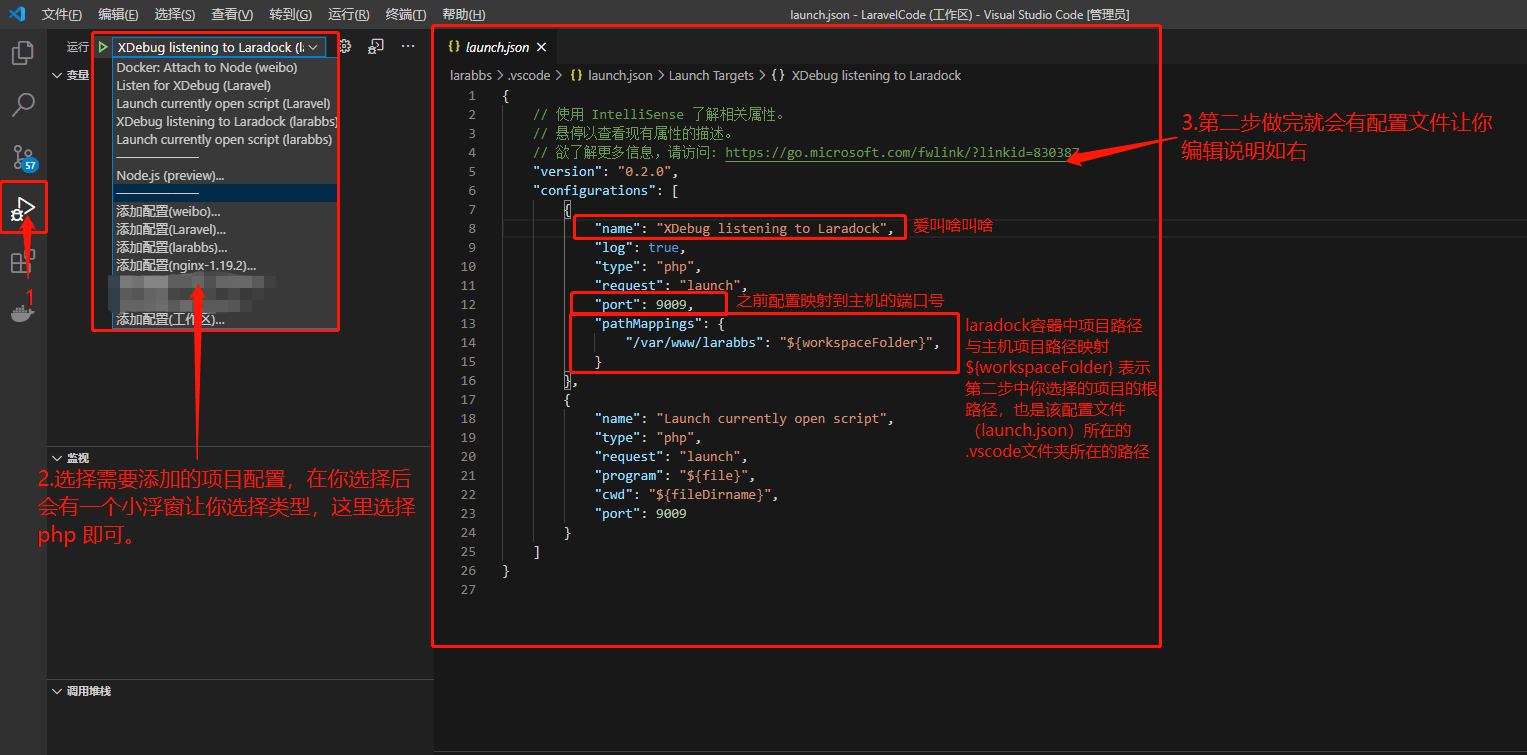
3.1 配置
在 VSCode 中搜索并安装 xDebug 扩展:
至此配置完成,接下来我们测试一下是否可以成功 debug 。
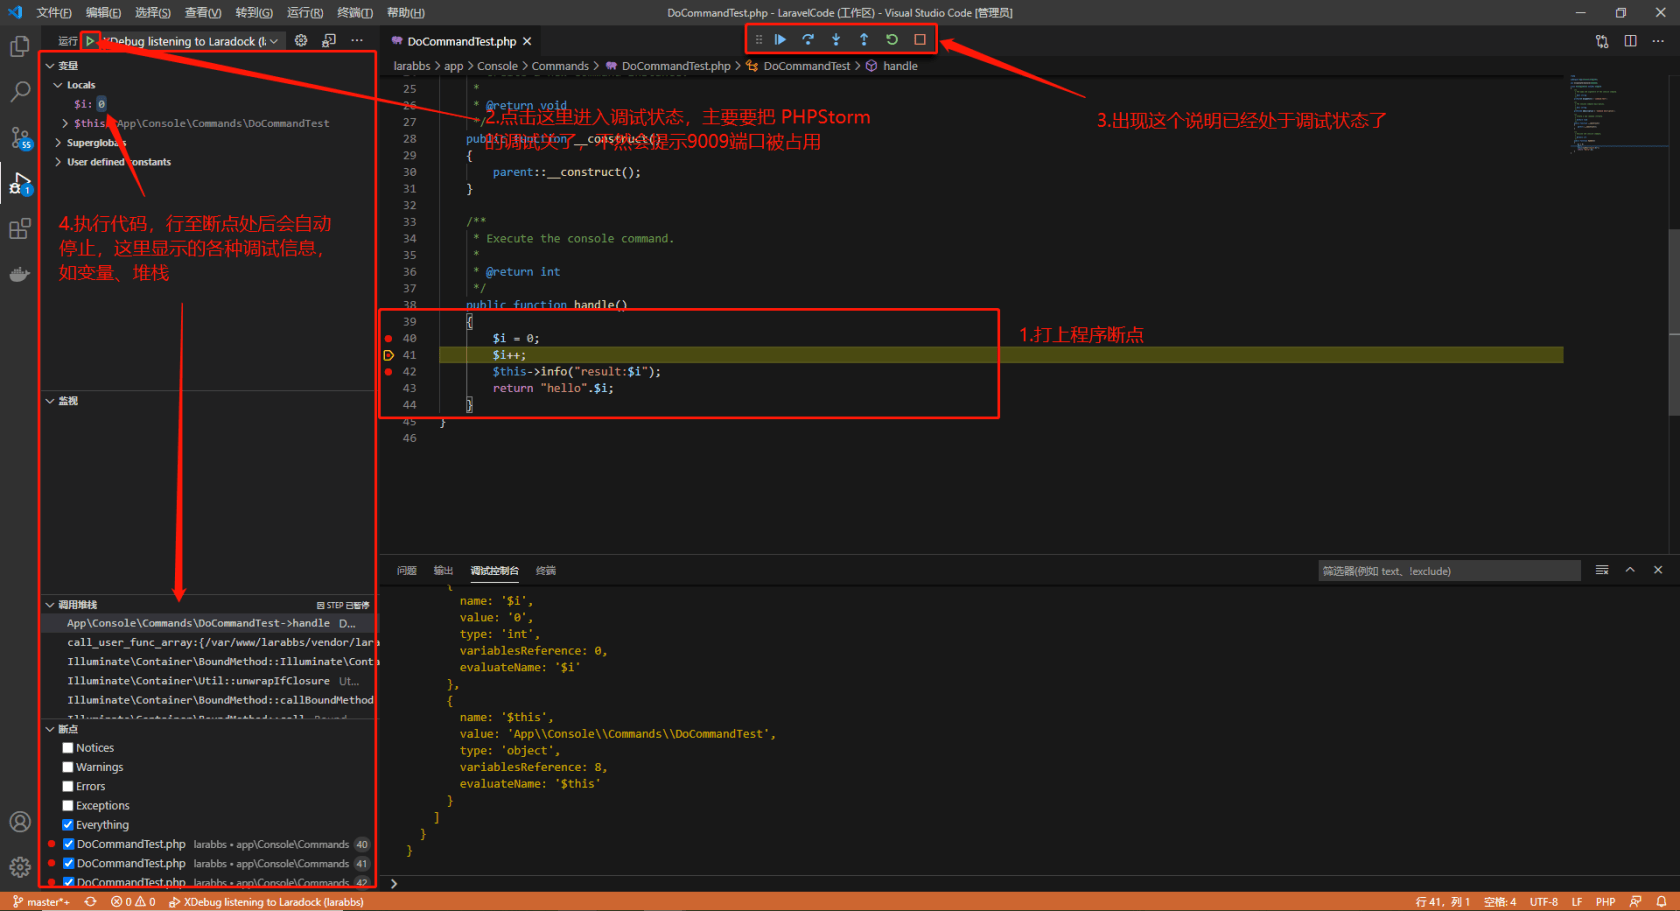
3.2 如何使用
4. 参考文章
- onthink.com/2019/02/20/mac-laradoc...
- 博客:基于 Laradock 在 PHPStorm 和 VS Code 下使用 Xdebug (Mac 篇)
- 博客:Laradock 使用 PhpStorm Debug 代码
- 博客:基于 docker 开发环境下-配置 PHPStorm xdebug
本作品采用《CC 协议》,转载必须注明作者和本文链接


 关于 LearnKu


推荐文章: