
分析内存泄漏和goroutine泄漏
4 / 1 / 创建于 4年前 /
 xing393939 的个人博客
参考资料
- 实战Go内存泄露
- Hi, 使用多年的go pprof检查内存泄漏的方法居然是错的
- 如何使用pprof见之前的文章使用pprof进行性能分析
分析内存泄漏
示例代码:
// 内存泄漏的例子
package main

import (
    "net/http"
    _ "net/http/pprof"
    "time"
)

func main() {
    // 开启pprof
    go func() {
        http.ListenAndServe("0.0.0.0:6060", nil)
    }()

    tick := time.Tick(time.Second / 100)
    var buf []byte
    for range tick {
        buf = append(buf, make([]byte, 1024*1024)...)
    }
}导出时间点1的堆的profile: curl -s http://127.0.0.1:6060/debug/pprof/heap > base.heap
导出时间点2的堆的profile: curl -s http://127.0.0.1:6060/debug/pprof/heap > current.heap
对比两个时间点堆栈的差异:go tool pprof --http :8080 --base base.heap current.heap
分析goroutine泄漏
示例代码:
// goroutine泄露导致内存泄漏
package main

import (
    "net/http"
    _ "net/http/pprof"
    "time"
)

func main() {
    // 开启pprof
    go func() {
        http.ListenAndServe("0.0.0.0:6060", nil)
    }()

    tick := time.Tick(time.Second / 10)
    i := 0
    for range tick {
        i++
        go allocFunc(i)
    }
}

func allocFunc(i int) {
    defer print(i, "\n")
    buf := make([]byte, 1024*1024*10)
    print(len(buf), " ", i, "\n")
    select {}
}访问127.0.0.1:6060/debug/pprof/goroutin...
其中展示的信息如下: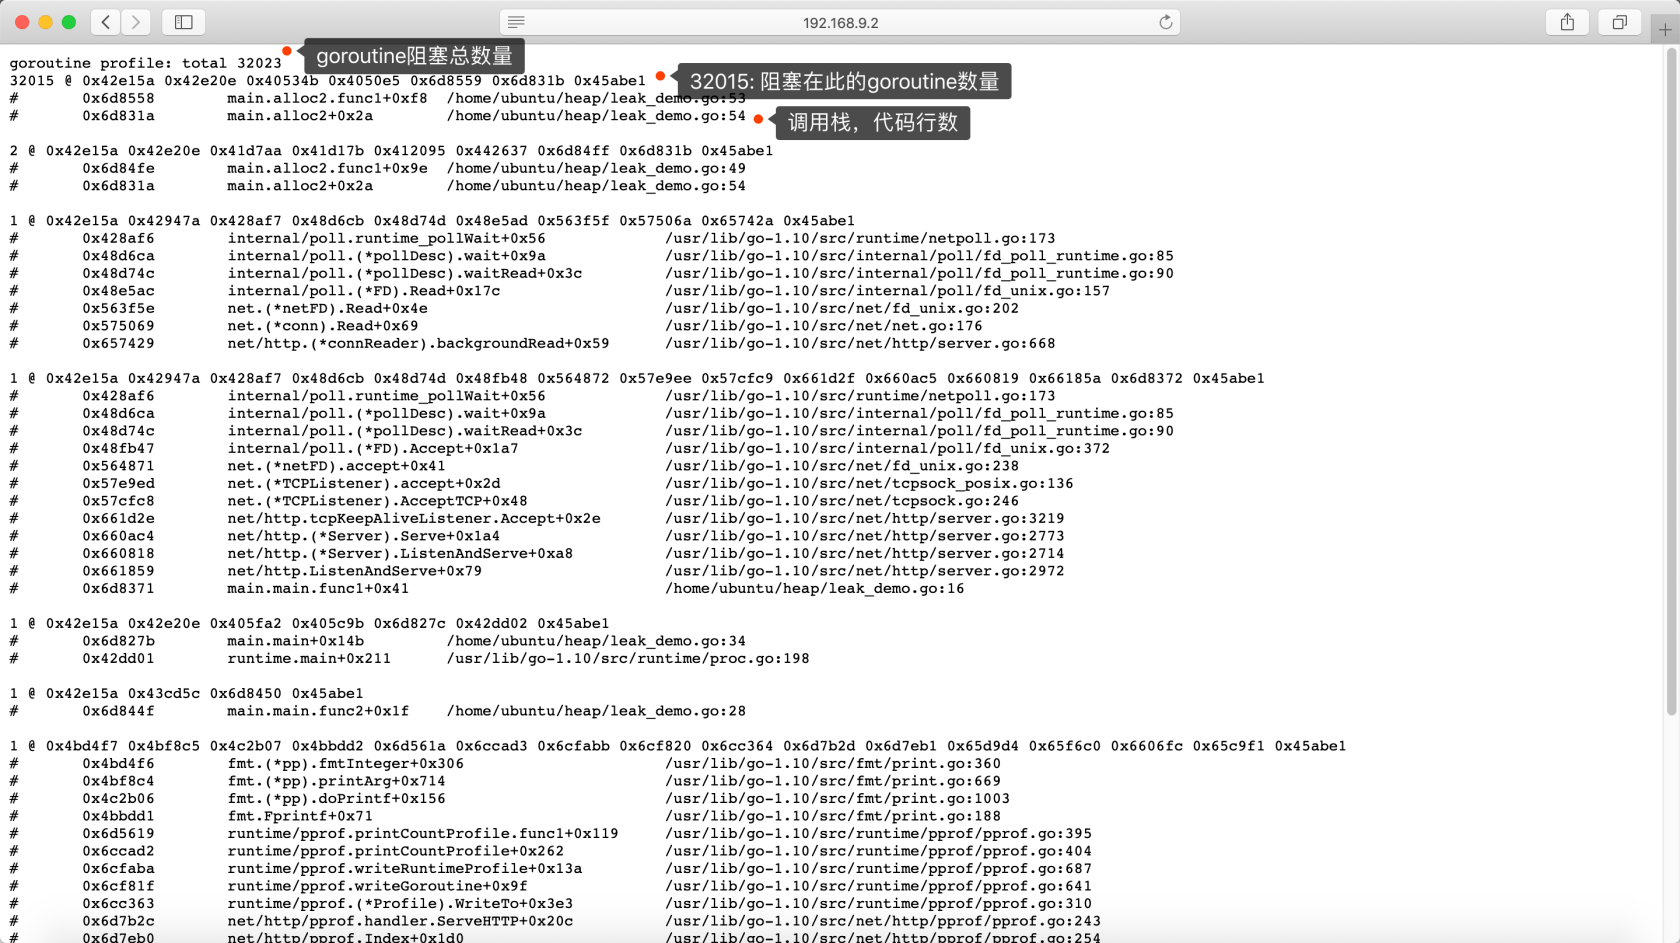
通过持续观察第一行的goroutine profile total展示的goroutine数量来判断是否有goroutine泄漏,同时可以查看其中的goroutine都卡在代码的哪一行。
访问127.0.0.1:6060/debug/pprof/goroutin...
可以查看其中的goroutine已经运行了多久。
本作品采用《CC 协议》,转载必须注明作者和本文链接


 关于 LearnKu


推荐文章: