
快速上手 go 1.20 集成测试覆盖率统计 [强烈推荐体验一下]
29 / 3 / 创建于 3年前 /
 我们只希望世界和平 的个人博客
go 1.20 带来的覆盖测试是一个代码质量保证的又一利器。设想一下,你将开发完的程序部署到测试环境后交付测试同学进行测试。测试同学经过测试完成后,我们开始查看测试期间程序运行都覆盖到了哪些代码,是不是有关键代码遗漏未测。go 1.20 开箱自带的工具让我们可以更轻松无引入的实现这一测试覆盖统计的能力。
首先,我们进入项目编译项目需要加入指定参数,并且输出再 ./tmp/main 下
go build -o ./tmp/main -cover之后我们设置一个环境变量,这个变量就是覆盖统计数据所在的目录
export GOCOVERDIR=/Users/thh/workspace/thh/tmp/mycovdata再之后我们运行我们之前编译好的程序 (我这里写的是一个web服务)
./tmp/main serve在这以后我们可以打开网页正常的运行我们的程序,调用对应的接口测试功能,运行一段时间后,我们进行覆盖统计的整理。有以下几个命令。
命令一 可以直接控制台输出统计
$go tool covdata percent -i=/Users/thh/workspace/thh/tmp/mycovdata/
        thh     coverage: 100.0% of statements
        thh/app/console coverage: 81.7% of statements
        thh/app/console/cmd     coverage: 4.2% of statements
        thh/app/console/cmd/demo        coverage: 9.9% of statements
        thh/app/console/cmd/ignore      coverage: 50.0% of statements
        thh/app/console/cmd/tspider     coverage: 1.5% of statements
        thh/app/console/codemake        coverage: 4.4% of statements
        thh/app/console/one     coverage: 33.3% of statements
        thh/app/console/shadow  coverage: 50.0% of statements
        thh/app/http/controllers        coverage: 5.8% of statements
        thh/app/http/controllers/component      coverage: 22.2% of statements
...
命令二是进行整理
go tool covdata textfmt -i=/Users/thh/workspace/thh/tmp/mycovdata/  -o /Users/thh/workspace/thh/tmp/profile.txt
# 项目所有文件

go tool covdata textfmt -i=/Users/thh/workspace/thh/tmp/mycovdata/ -pkg="thh,thh/app/http" -o /Users/thh/workspace/thh/tmp/profile.txt
# 项目 thh,thh/app/http 这两个包,不包括子包 例如thh/amrs,thh/app/http/controllers 这两个包是不会被统计的,如果需要统计子包看下面的

go tool covdata textfmt -i=/Users/thh/workspace/thh/tmp/mycovdata/ -pkg="thh,thh/arms/...,thh/app/http/...,thh/app/models/...,thh/app/service/..." -o /Users/thh/workspace/thh/tmp/profile.txt
#  统计并且 thh/arms/ thh/app/http/ thh/app/models/  thh/app/service/ 这几个包的子包也进行统计
之后我们就可以再进行展示命令操作了,一个是 text 一个是 html,分别是
$ go tool cover -func=/Users/thh/workspace/thh/tmp/profile.txt
thh/app/http/controllers/about_controller.go:10:                                GetUseMem                       0.0%
thh/app/http/controllers/about_controller.go:16:                                About                           0.0%
thh/app/http/controllers/about_controller.go:27:                                NewCat                          0.0%
thh/app/http/controllers/about_controller.go:31:                                Params                          0.0%
thh/app/http/controllers/bbs_controller.go:21:                                  GetArticles                     0.0%
thh/app/http/controllers/bbs_controller.go:54:                                  GetArticlesDetail               0.0%
thh/app/http/controllers/component/component.go:19:                             GetUser                         0.0%
thh/app/http/controllers/component/component.go:37:                             BuildResponse                   100.0%
thh/app/http/controllers/component/component.go:41:                             SuccessResponse                 100.0%
以及
 go tool cover -html=/Users/thh/workspace/thh/tmp/profile.txt
 # 这个命令运行后会在默认浏览器直接打开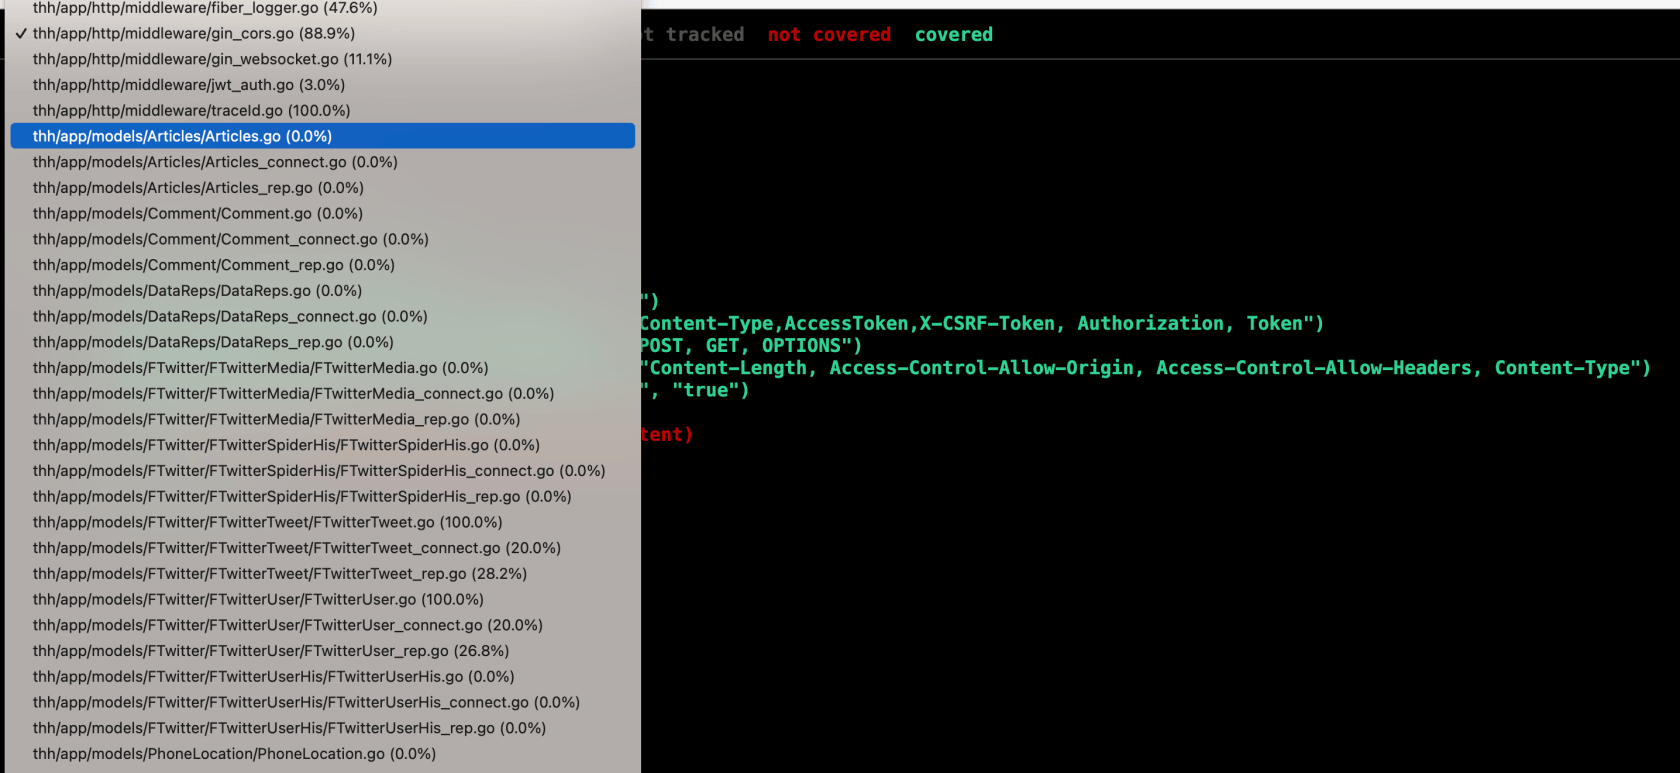
如图,分别用3色展示了不追逐/未覆盖/覆盖的代码。功能比较容易上手,大家可以亲自试一下。
Coverage profiling support for integration tests - The Go Programming Language
go 官网的介绍也可以看一下,比较详细,比这几天网上 go 1.20 新功能介绍要更加仔细,专门介绍覆盖统计的使用
本作品采用《CC 协议》,转载必须注明作者和本文链接
power by GooseForum


 关于 LearnKu


推荐文章: