
测试用 Octane 加速 Laravel10,并发达到4倍左右,同时对比Hyperf3压力测试
252 / 32 / 创建于 3年前 /
 岭南伊爸 的个人博客
原文地址:coderpan.com/php/hyperf-laravel-pe... 欢迎收藏。
Laravel 开发爽,但性能完全无法忍受。刚完成一个项目,有点时间,试试看用 octane 加持后是否能摆脱 Laravel 的性能魔咒。Laravel 应用基本可可无缝迁移到 Hyperf,因此同时测试 Hyperf,看看 Swoole 协程异步加持的 Hyperf 是不是比 Laravel 快很多。
测试环境
服务器: 阿里轻量云服务器
CPU: 2核
内存: 2G
OS:  CentOS 8.5
PHP: 8.2.5
MySQL: 8.0
Swoole: 5.0.3
Laravel: 10.8
Hyperf: 3.0
Laravel 压测
# 创建 Demo 模型、迁移、控制器
php artisan make:model Demo -mc
demos 表迁移结构:
    Schema::create('demos', function (Blueprint $table) {
        $table->id();
        $table->string('text');
        $table->timestamps();
    });
Demo 模型类:
namespace App\Models;

use Illuminate\Database\Eloquent\Factories\HasFactory;
use Illuminate\Database\Eloquent\Model;

class Demo extends Model
{
    use HasFactory;
    protected $fillable = ['text'];
}
DemoController 控制器类:
namespace App\Http\Controllers;

use Illuminate\Http\Request;

class DemoController extends Controller
{
    // 返回简单字符串
    public function hello()
    {
        return 'hello laravel';
    }
    // 读取一条记录
    public function dbRead()
    {
        $demo = \App\Models\Demo::find(1);
        return ['text' => $demo->text];
    }

    // 读取一个列表
    public function dbQuery()
    {
        $items = \App\Models\Demo::query()
            ->where('id', '>', 100)
            ->limit(10)
            ->get();
        return ['items' => $items];
    }

    // 写入一条记录
    public function dbWrite()
    {
        $demo = \App\Models\Demo::create([
            'text' => date('Y-m-d H:i:s'). '/' . microtime()
        ]);
        return ['id' => $demo->id];
    }
}
php artisan route:list 查看路由:
  GET|HEAD   db-query ........................ DemoController@dbQuery
  GET|HEAD   db-read .......................... DemoController@dbRead
  GET|HEAD   db-write ........................ DemoController@dbWrite
  GET|HEAD   hello ............................. DemoController@hello
Laravel 默认启用了文件存储的 Session,每次压测前先删除 session 文件,否则 session 文件多了影响性能。
换成 redis 存储 session 可不用每次压测前删除 session,对测试结果影响不大。
- 启动 Laravel web 命令:
php artisan serve - 启动 Laravel octane 命令:
php artisan octane:start
应使用类似 production 环境,才能获得有意义压测的数据,因此应做一定的优化再测试。
Laravel 性能优化设置:
- PHP 启用 opcache,并且 cli 也启用 opcache(命令行没有开启 opcache 时,速度极慢,Laravel 只有 8~10请求/秒)
- composer install –optimize-autoloader –no-dev
- php artisan route:cache
- php artisan config:cache
- .evn 设置
- APP_DEBUG=false
- LOG_LEVEL=error
Laravel 压测结果
wrk -c100 -t50 http://localhost:8000/hello

Running 10s test @ http://localhost:8000/hello
  50 threads and 100 connections
  Thread Stats   Avg      Stdev     Max   +/- Stdev
    Latency   532.32ms  157.68ms   1.53s    77.46%
    Req/Sec     3.39      3.11    20.00     83.08%
  1198 requests in 10.09s, 1.32MB read
  Socket errors: connect 0, read 1198, write 0, timeout 0
Requests/sec:    118.74
Transfer/sec:    133.70KB

Running 10s test @ http://localhost:8000/hello
  50 threads and 100 connections
  Thread Stats   Avg      Stdev     Max   +/- Stdev
    Latency   506.47ms  142.80ms   1.68s    79.62%
    Req/Sec     3.68      3.19    20.00     81.33%
  1250 requests in 10.08s, 1.37MB read
  Socket errors: connect 0, read 1250, write 0, timeout 0
Requests/sec:    123.95
Transfer/sec:    139.56KB

Running 10s test @ http://localhost:8000/hello
  50 threads and 100 connections
  Thread Stats   Avg      Stdev     Max   +/- Stdev
    Latency   521.74ms  154.37ms   1.40s    79.98%
    Req/Sec     3.65      3.32    20.00     79.16%
  1209 requests in 10.09s, 1.33MB read
  Socket errors: connect 0, read 1209, write 0, timeout 0
Requests/sec:    119.83
Transfer/sec:    134.92KB

-------------

wrk -c100 -t50 http://localhost:8000/db-write

Running 10s test @ http://localhost:8000/db-write
  50 threads and 100 connections
  Thread Stats   Avg      Stdev     Max   +/- Stdev
    Latency   895.52ms  250.54ms   1.47s    78.34%
    Req/Sec     3.42      3.85    20.00     78.02%
  697 requests in 10.06s, 778.68KB read
  Socket errors: connect 0, read 697, write 0, timeout 0
Requests/sec:     69.26
Transfer/sec:     77.38KB

Running 10s test @ http://localhost:8000/db-write
  50 threads and 100 connections
  Thread Stats   Avg      Stdev     Max   +/- Stdev
    Latency   887.94ms  245.89ms   1.44s    79.10%
    Req/Sec     2.64      3.28    20.00     86.38%
  713 requests in 10.06s, 795.86KB read
  Socket errors: connect 0, read 713, write 0, timeout 0
Requests/sec:     70.85
Transfer/sec:     79.08KB

Running 10s test @ http://localhost:8000/db-write
  50 threads and 100 connections
  Thread Stats   Avg      Stdev     Max   +/- Stdev
    Latency   884.36ms  237.37ms   1.39s    79.35%
    Req/Sec     2.96      3.53    20.00     83.78%
  707 requests in 10.10s, 789.16KB read
  Socket errors: connect 0, read 707, write 0, timeout 0
Requests/sec:     70.00
Transfer/sec:     78.14KB

--------

wrk -c100 -t50 http://localhost:8000/db-read

Running 10s test @ http://localhost:8000/db-read
  50 threads and 100 connections
curl http://localhost:8000/db-read  Thread Stats   Avg      Stdev     Max   +/- Stdev
    Latency   731.21ms  200.69ms   1.19s    74.56%
    Req/Sec     2.96      3.26    20.00     86.09%
  853 requests in 10.07s, 0.96MB read
  Socket errors: connect 0, read 853, write 0, timeout 0
Requests/sec:     84.74
Transfer/sec:     97.57KB

Running 10s test @ http://localhost:8000/db-read
  50 threads and 100 connections
  Thread Stats   Avg      Stdev     Max   +/- Stdev
    Latency   752.27ms  195.26ms   1.38s    75.03%
    Req/Sec     2.61      2.82    10.00     88.54%
  837 requests in 10.07s, 0.94MB read
  Socket errors: connect 0, read 837, write 0, timeout 0
Requests/sec:     83.08
Transfer/sec:     95.77KB

----------

wrk -c100 -t50 http://localhost:8000/db-query

Running 10s test @ http://localhost:8000/db-query
  50 threads and 100 connections
  Thread Stats   Avg      Stdev     Max   +/- Stdev
    Latency   824.16ms  233.11ms   1.40s    78.47%
    Req/Sec     2.88      3.43    20.00     84.36%
  761 requests in 10.07s, 1.89MB read
  Socket errors: connect 0, read 761, write 0, timeout 4
Requests/sec:     75.54
Transfer/sec:    192.39KB

Running 10s test @ http://localhost:8000/db-query
  50 threads and 100 connections
  Thread Stats   Avg      Stdev     Max   +/- Stdev
    Latency   848.49ms  222.82ms   1.58s    78.80%
    Req/Sec     2.40      2.80    10.00     89.81%
  751 requests in 10.07s, 1.87MB read
  Socket errors: connect 0, read 751, write 0, timeout 1
Requests/sec:     74.58
Transfer/sec:    189.94KB

Running 10s test @ http://localhost:8000/db-query
  50 threads and 100 connections
  Thread Stats   Avg      Stdev     Max   +/- Stdev
    Latency   807.29ms  223.21ms   1.29s    73.96%
    Req/Sec     2.85      3.29    20.00     86.27%
  772 requests in 10.08s, 1.92MB read
  Socket errors: connect 0, read 772, write 0, timeout 0
Requests/sec:     76.58
Transfer/sec:    195.04KB
Laravel Octane 加速压测结果
wrk -c100 -t50 http://localhost:8000/hello

Running 10s test @ http://localhost:8000/hello
  50 threads and 100 connections
  Thread Stats   Avg      Stdev     Max   +/- Stdev
    Latency   177.55ms   54.69ms 445.71ms   88.37%
    Req/Sec    11.73      4.83    40.00     68.76%
  5682 requests in 10.10s, 6.08MB read
Requests/sec:    562.63
Transfer/sec:    616.48KB

Running 10s test @ http://localhost:8000/hello
  50 threads and 100 connections
  Thread Stats   Avg      Stdev     Max   +/- Stdev
    Latency   168.74ms   39.23ms 327.41ms   89.35%
    Req/Sec    11.94      4.57    40.00     72.73%
  5925 requests in 10.09s, 6.34MB read
Requests/sec:    587.03
Transfer/sec:    643.21KB

--------

wrk -c100 -t50 http://localhost:8000/db-write

Running 10s test @ http://localhost:8000/db-write
  50 threads and 100 connections
  Thread Stats   Avg      Stdev     Max   +/- Stdev
    Latency   426.58ms   70.81ms 601.13ms   82.37%
    Req/Sec     5.31      2.97    20.00     67.10%
  2286 requests in 10.05s, 2.43MB read
Requests/sec:    227.37
Transfer/sec:    247.13KB

Running 10s test @ http://localhost:8000/db-write
  50 threads and 100 connections
  Thread Stats   Avg      Stdev     Max   +/- Stdev
    Latency   409.70ms   60.49ms 595.28ms   90.20%
    Req/Sec     5.62      3.08    20.00     62.37%
  2399 requests in 10.04s, 2.55MB read
Requests/sec:    238.95
Transfer/sec:    259.72KB

Running 10s test @ http://localhost:8000/db-write
  50 threads and 100 connections
  Thread Stats   Avg      Stdev     Max   +/- Stdev
    Latency   404.70ms   61.26ms 550.82ms   88.27%
    Req/Sec     5.94      3.33    20.00     58.46%
  2421 requests in 10.05s, 2.57MB read
Requests/sec:    240.86
Transfer/sec:    261.79KB

----------

wrk -c100 -t50 http://localhost:8000/db-read

Running 10s test @ http://localhost:8000/db-read
  50 threads and 100 connections
  Thread Stats   Avg      Stdev     Max   +/- Stdev
    Latency   250.41ms   52.70ms 553.20ms   87.29%
    Req/Sec     8.21      2.53    30.00     73.76%
  3974 requests in 10.09s, 4.35MB read
Requests/sec:    393.73
Transfer/sec:    441.41KB

Running 10s test @ http://localhost:8000/db-read
  50 threads and 100 connections
  Thread Stats   Avg      Stdev     Max   +/- Stdev
    Latency   259.17ms   62.02ms 564.60ms   89.01%
    Req/Sec     8.00      2.68    20.00     72.96%
  3817 requests in 10.09s, 4.18MB read
Requests/sec:    378.45
Transfer/sec:    424.28KB

--------

wrk -c100 -t50 http://localhost:8000/db-query

Running 10s test @ http://localhost:8000/db-query
  50 threads and 100 connections
  Thread Stats   Avg      Stdev     Max   +/- Stdev
    Latency   320.13ms   54.99ms 487.82ms   82.09%
    Req/Sec     6.63      2.82    20.00     62.39%
  3094 requests in 10.08s, 7.61MB read
Requests/sec:    306.82
Transfer/sec:    772.74KB

Running 10s test @ http://localhost:8000/db-query
  50 threads and 100 connections
  Thread Stats   Avg      Stdev     Max   +/- Stdev
    Latency   314.66ms   59.53ms 640.37ms   86.54%
    Req/Sec     6.59      2.65    20.00     66.75%
  3157 requests in 10.10s, 7.76MB read
Requests/sec:    312.72
Transfer/sec:    787.61KB

Running 10s test @ http://localhost:8000/db-query
  50 threads and 100 connections
  Thread Stats   Avg      Stdev     Max   +/- Stdev
    Latency   317.38ms   60.38ms 492.53ms   83.33%
    Req/Sec     6.41      2.59    20.00     59.78%
  3131 requests in 10.09s, 7.70MB read
Requests/sec:    310.27
Transfer/sec:    781.44KB
Hyperf 压测
创建表迁移、模型、控制器命令:
php bin/hyperf.php gen:migration create_demos_table
php bin/hyperf.php gen:model demos
php bin/hyperf.php gen:controller DemoController
demos 表迁移结构:
    Schema::create('demos', function (Blueprint $table) {
        $table->bigIncrements('id');
        $table->string('text');
        $table->datetimes();
    });
Hyperf Demo 模型类:
namespace App\Model;

class Demo extends Model
{
    protected ?string $table = 'demos';
    protected array $fillable = ['text'];
}
Hyperf DemoController 控制器类:
namespace App\Controller;

use Hyperf\HttpServer\Contract\RequestInterface;
use Hyperf\HttpServer\Contract\ResponseInterface;
use Hyperf\HttpServer\Annotation\AutoController;

#[AutoController]
class DemoController
{
    public function hello()
    {
        return 'hello hyperf';
    }

    public function dbRead()
    {
        $demo = \App\Model\Demo::find(1);
        return ['text' => $demo->text];
    }

    public function dbQuery()
    {
        $items = \App\Model\Demo::query()
            ->where('id', '>', 100)
            ->limit(10)
            ->get();
        return ['items' => $items];
    }

    public function dbWrite()
    {
        $demo = \App\Model\Demo::create([
            'text' => date('Y-m-d H:i:s'). '/' . microtime()
        ]);
        return ['id' => $demo->id];
    }
}
php bin/hyperf.php describe:routes 查看路由表:
+--------+---------------+---------------+----------------------------------------+------------+
| Server | Method        | URI           | Action                                 | Middleware |
+--------+---------------+---------------+----------------------------------------+------------+
| http   | GET|POST|HEAD | /demo/hello   | App\Controller\DemoController::hello   |            |
+--------+---------------+---------------+----------------------------------------+------------+
| http   | GET|POST|HEAD | /demo/dbRead  | App\Controller\DemoController::dbRead  |            |
+--------+---------------+---------------+----------------------------------------+------------+
| http   | GET|POST|HEAD | /demo/dbQuery | App\Controller\DemoController::dbQuery |            |
+--------+---------------+---------------+----------------------------------------+------------+
| http   | GET|POST|HEAD | /demo/dbWrite | App\Controller\DemoController::dbWrite |            |
+--------+---------------+---------------+----------------------------------------+------------+
压力测试结果
压力测试应模拟 production 环境才能得到有效的数据
- 日志级别设为 ERROR
- 执行 composer install –no-dev
- 用 redis 存 session
启用 session 后压测
Laravel 默认启用 session,实际项目也经常用到 session,因此特开启 session 来测试,以对比数据。
wrk -c100 -t50 http://localhost:9501/demo/hello

Running 10s test @ http://localhost:9501/demo/hello
  50 threads and 100 connections
  Thread Stats   Avg      Stdev     Max   +/- Stdev
    Latency    21.13ms    5.85ms  59.68ms   72.33%
    Req/Sec    94.89     17.11   161.00     74.11%
  47743 requests in 10.10s, 14.39MB read
Requests/sec:   4726.73
Transfer/sec:      1.42MB

Running 10s test @ http://localhost:9501/demo/hello
  50 threads and 100 connections
  Thread Stats   Avg      Stdev     Max   +/- Stdev
    Latency    21.07ms    5.79ms  62.20ms   72.65%
    Req/Sec    95.10     16.16   210.00     77.07%
  47667 requests in 10.10s, 14.36MB read
Requests/sec:   4719.28
Transfer/sec:      1.42MB

Running 10s test @ http://localhost:9501/demo/hello
  50 threads and 100 connections
  Thread Stats   Avg      Stdev     Max   +/- Stdev
    Latency    20.59ms    5.66ms  75.52ms   75.40%
    Req/Sec    97.62     15.88   191.00     72.00%
  48965 requests in 10.10s, 14.76MB read
Requests/sec:   4847.50
Transfer/sec:      1.46MB
=-------

wrk -c100 -t50 http://localhost:9501/demo/dbRead

Running 10s test @ http://localhost:9501/demo/dbRead
  50 threads and 100 connections
  Thread Stats   Avg      Stdev     Max   +/- Stdev
    Latency    57.21ms    9.57ms 102.89ms   69.10%
    Req/Sec    34.72      6.86    60.00     89.01%
  17515 requests in 10.08s, 6.06MB read
Requests/sec:   1738.04
Transfer/sec:    616.12KB

wrk -c100 -t50 http://localhost:9501/demo/dbRead
Running 10s test @ http://localhost:9501/demo/dbRead
  50 threads and 100 connections
  Thread Stats   Avg      Stdev     Max   +/- Stdev
    Latency    58.47ms    8.84ms  98.09ms   68.81%
    Req/Sec    33.95      6.69    50.00     89.76%
  17132 requests in 10.07s, 5.93MB read
Requests/sec:   1701.90
Transfer/sec:    603.31KB

-----------

wrk -c100 -t50 http://localhost:9501/demo/dbWrite
Running 10s test @ http://localhost:9501/demo/dbWrite
  50 threads and 100 connections
  Thread Stats   Avg      Stdev     Max   +/- Stdev
    Latency    92.56ms   24.26ms 202.84ms   82.88%
    Req/Sec    21.62      6.87    40.00     60.80%
  10841 requests in 10.10s, 3.33MB read
Requests/sec:   1073.48
Transfer/sec:    337.56KB

wrk -c100 -t50 http://localhost:9501/demo/dbWrite
Running 10s test @ http://localhost:9501/demo/dbWrite
  50 threads and 100 connections
  Thread Stats   Avg      Stdev     Max   +/- Stdev
    Latency    89.74ms   21.19ms 196.04ms   85.71%
    Req/Sec    22.28      6.72    40.00     69.81%
  11178 requests in 10.10s, 3.43MB read
Requests/sec:   1106.78
Transfer/sec:    348.03KB
----------
wrk -c100 -t50 http://localhost:9501/demo/dbQuery
Running 10s test @ http://localhost:9501/demo/dbQuery
  50 threads and 100 connections
  Thread Stats   Avg      Stdev     Max   +/- Stdev
    Latency   100.40ms   17.07ms 182.81ms   72.75%
    Req/Sec    19.51      4.85    40.00     77.32%
  9959 requests in 10.10s, 15.52MB read
Requests/sec:    985.73
Transfer/sec:      1.54MB

wrk -c100 -t50 http://localhost:9501/demo/dbQuery
Running 10s test @ http://localhost:9501/demo/dbQuery
  50 threads and 100 connections
  Thread Stats   Avg      Stdev     Max   +/- Stdev
    Latency    99.41ms   16.11ms 179.89ms   72.34%
    Req/Sec    19.68      4.84    40.00     77.20%
  10063 requests in 10.10s, 15.68MB read
Requests/sec:    996.01
Transfer/sec:      1.55MB
没有启用 session
wrk -c100 -t50 http://localhost:9501/demo/hello
Running 10s test @ http://localhost:9501/demo/hello
  50 threads and 100 connections
  Thread Stats   Avg      Stdev     Max   +/- Stdev
    Latency     4.74ms    2.11ms  36.46ms   77.28%
    Req/Sec   430.12     74.37     1.72k    84.11%
  214892 requests in 10.10s, 31.56MB read
Requests/sec:  21276.73
Transfer/sec:      3.12MB

wrk -c100 -t50 http://localhost:9501/demo/hello
Running 10s test @ http://localhost:9501/demo/hello
  50 threads and 100 connections
  Thread Stats   Avg      Stdev     Max   +/- Stdev
    Latency     4.69ms    2.02ms  28.45ms   76.29%
    Req/Sec   433.41     68.42     1.49k    77.41%
  217018 requests in 10.10s, 31.87MB read
Requests/sec:  21489.59
Transfer/sec:      3.16MB

--------

wrk -c100 -t50 http://localhost:9501/demo/dbWrite
Running 10s test @ http://localhost:9501/demo/dbWrite
  50 threads and 100 connections
  Thread Stats   Avg      Stdev     Max   +/- Stdev
    Latency    62.00ms    7.41ms  94.33ms   70.09%
    Req/Sec    32.11      7.08    50.00     53.46%
  16173 requests in 10.07s, 2.47MB read
Requests/sec:   1605.77
Transfer/sec:    250.90KB

wrk -c100 -t50 http://localhost:9501/demo/dbWrite
Running 10s test @ http://localhost:9501/demo/dbWrite
  50 threads and 100 connections
  Thread Stats   Avg      Stdev     Max   +/- Stdev
    Latency    64.72ms   14.42ms 178.26ms   86.98%
    Req/Sec    30.87      8.23    50.00     46.63%
  15520 requests in 10.08s, 2.37MB read
Requests/sec:   1539.30
Transfer/sec:    241.14KB

--------

wrk -c100 -t50 http://localhost:9501/demo/dbRead
Running 10s test @ http://localhost:9501/demo/dbRead
  50 threads and 100 connections
  Thread Stats   Avg      Stdev     Max   +/- Stdev
    Latency    37.07ms    6.47ms  88.43ms   74.21%
    Req/Sec    53.89      8.11    80.00     80.86%
  27173 requests in 10.10s, 5.21MB read
Requests/sec:   2689.94
Transfer/sec:    528.01KB

wrk -c100 -t50 http://localhost:9501/demo/dbRead
Running 10s test @ http://localhost:9501/demo/dbRead
  50 threads and 100 connections
  Thread Stats   Avg      Stdev     Max   +/- Stdev
    Latency    36.72ms    6.31ms  68.25ms   69.97%
    Req/Sec    54.39      8.39   130.00     80.21%
  27416 requests in 10.10s, 5.26MB read
Requests/sec:   2713.93
Transfer/sec:    532.71KB

----------

wrk -c100 -t50 http://localhost:9501/demo/dbQuery
Running 10s test @ http://localhost:9501/demo/dbQuery
  50 threads and 100 connections
  Thread Stats   Avg      Stdev     Max   +/- Stdev
    Latency    77.94ms   11.51ms 140.99ms   73.13%
    Req/Sec    25.29      6.51    49.00     87.57%
  12853 requests in 10.11s, 18.04MB read
Requests/sec:   1271.76
Transfer/sec:      1.79MB

wrk -c100 -t50 http://localhost:9501/demo/dbQuery
Running 10s test @ http://localhost:9501/demo/dbQuery
  50 threads and 100 connections
  Thread Stats   Avg      Stdev     Max   +/- Stdev
    Latency    73.68ms   10.80ms 125.51ms   70.80%
    Req/Sec    26.79      6.74    50.00     48.29%
  13598 requests in 10.10s, 19.09MB read
Requests/sec:   1346.40
Transfer/sec:      1.89MB
数据对比(每秒处理次数)
| - | Laravel | Laravel + Octane | Hyperf 启用 session | Hyperf 不启用 session |
|---|---|---|---|---|
| 返回简单字符串 | 120 | 560 | 4700 | 21000 |
| MySQL 表写入 | 70 | 230 | 1000 | 1500 |
| MySQL 单条读取(WHERE id = 1) | 80 | 380 | 1700 | 2600 |
| MySQL 范围查询(WHERE id > 100 LIMIT 10) | 75 | 300 | 980 | 1200 |
总结
- Laravel 生产环境优化后速度基本能接受。
- Laravel 10 使用 Octane (Swoole) 加速,性能提升4倍左右;
- Hyperf3 如果不需要连接其他服务(如redis、MySQL)速度非常快。
- Hyperf3 用上 MySQL 后被拖后腿,速度是 Laravel Octane 加速后的 4倍左右。
现在你完全不必担心 Laravel 10 的性能问题,性能达到瓶颈时可用 Octane 加速,并发很高的部分可以迁移到 Hyperf。
补充
其中 Laravel 是用 php artisan serve 测试,用 nginx + php-fpm 性能还能翻倍,约是octane模式的一半多点。
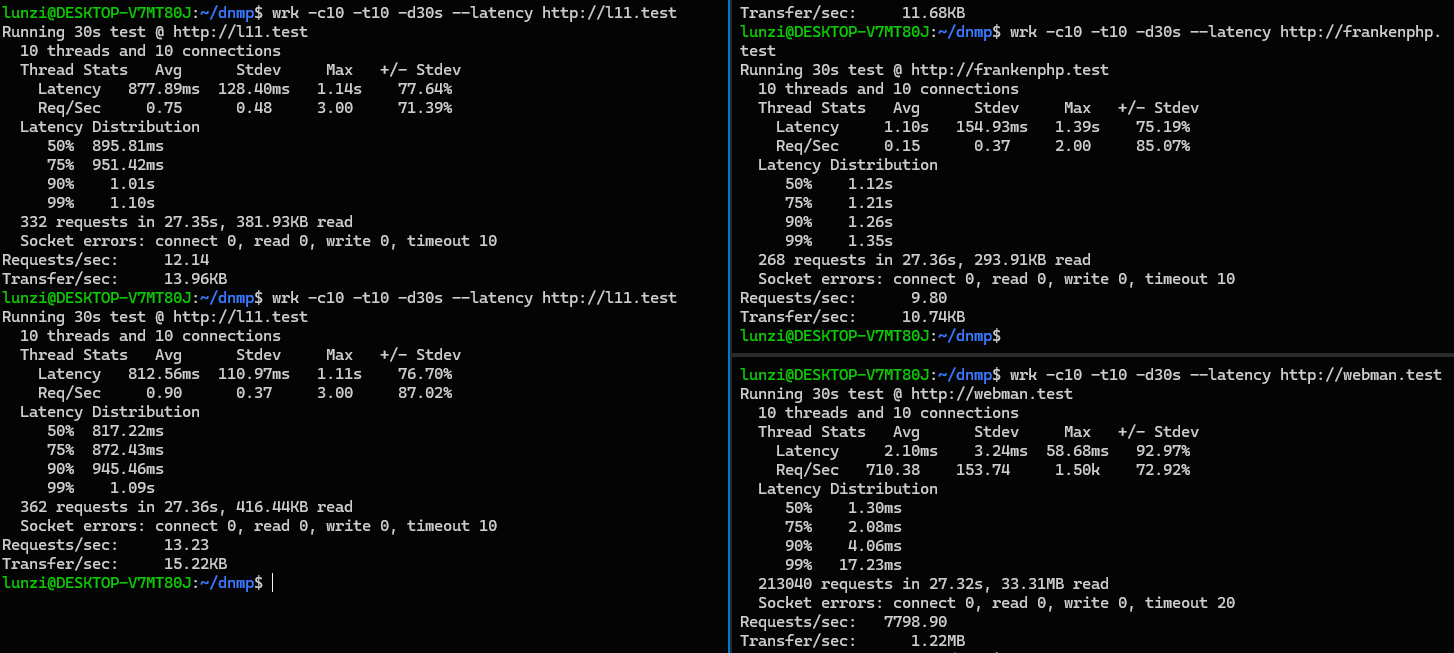
最近在同一台 2核2G 阿里轻云上压测 webman。webman 用的是默认设置(开session的),数据库操作用laravel的orm读写,同样的 wrk -c100 -t50。hello和单条记录、10条记录查询的并发大约是 Hyperf 不启用 session 的2倍,数据库写入并发是反过来的约1/2。
本作品采用《CC 协议》,转载必须注明作者和本文链接


 关于 LearnKu


推荐文章: