
基于 Windows + Laradock 在 vscode 上使用 xdebug 设置
11 / 2 / 创建于 7年前 /
 wulijieone 的个人博客
最近学习在 windows 上使用 laradock,花了几天时间各种找资料学习外加设置,终于把 vscode 和 laradock 的
xdebug连接上了。
安装 Xdebug 扩展
打开 laradock 目录下的 .env,搜索 WORKSPACE_INSTALL_XDEBUG 和 PHP_FPM_INSTALL_XDEBUG 都改为 true。
WORKSPACE_INSTALL_XDEBUG=true
PHP_FPM_INSTALL_XDEBUG=true
我的 Xdebug 配置
编辑 laradock/workspace/xdebug.ini 以及 laradock/php-fpm/xdebug.ini,我的具体配置如下:
xdebug.remote_host=docker.for.win.localhost
xdebug.remote_connect_back=0
xdebug.remote_port=9000
xdebug.idekey=PHPSTORM

xdebug.remote_autostart=1
xdebug.remote_enable=1
xdebug.cli_color=0
xdebug.profiler_enable=0
xdebug.profiler_output_dir="~/xdebug/phpstorm/tmp/profiling"

xdebug.remote_handler=dbgp
xdebug.remote_mode=req

xdebug.var_display_max_children=-1
xdebug.var_display_max_data=-1
xdebug.var_display_max_depth=-1
然后重新创建镜像和容器,时间主要花在这里了,尤其 apt-get 时间相当长,光是这里 build 花了我至少 1 个多小时,(╯‵□′)╯︵┻━┻$ docker-compose up -d nginx mysql redis workspace
我的 VS Code设置
vscode 主要是 pathMappings 这里,我把本地项目映射到了 /var/www/ 目录下,例如 /var/www/p2p、 /var/www/bbs
{
    // 使用 IntelliSense 了解相关属性。
    // 悬停以查看现有属性的描述。
    // 欲了解更多信息,请访问: https://go.microsoft.com/fwlink/?linkid=830387
    "version": "0.2.0",
    "configurations": [
        {
            "name": "Listen for XDebug",
            "type": "php",
            "request": "launch",
            "port": 9000,
            "log": true,
            "pathMappings": {
                "/var/www/p2p": "${workspaceRoot}",
            }
        },
        {
            "name": "Launch currently open script",
            "type": "php",
            "request": "launch",
            "program": "${file}",
            "cwd": "${fileDirname}",
            "port": 9000
        }
    ]
}
执行一下 Xdebug,连接成功,本来都要放弃使用 VS Code 的 ╮(╯▽╰)╭ ,现在终于不用换 PhpStorm 啦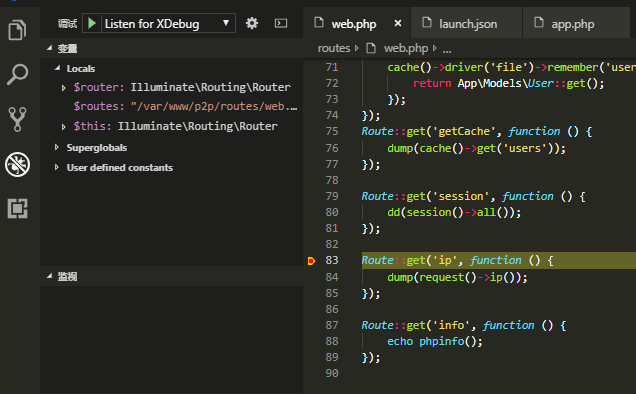
参考: https://learnku.com/articles/24389#配置Xdebug
本作品采用《CC 协议》,转载必须注明作者和本文链接


 关于 LearnKu


推荐文章: