
 architect director
 本书未发布
Go - wrk压测 - pprof
第一步:golang 支持pprof
package main

import (
    "net/http"
    _ "net/http/pprof"  //这一行不能少
)

func main() {
    http.ListenAndServe("0.0.0.0:6060", nil)
}
第二步:访问web
http://127.0.0.1:6060/debug/pprof/第三步:分析pprof
(1)每隔60s统计一次cpu耗时,并且在web上可视化。
go tool pprof http://localhost:6060/debug/pprof/profile\?seconds\=60
(pprof) help
(pprof) web(2)也可以点击第二步的页面上的profile,下载文件。然后执行命令:
go tool pprof path_of_pprof
(pprof) web
第四步:压测分析pprof
示例代码:
func BenchmarkBenchRequests(b *testing.B) {
    b.ResetTimer()
    b.SetParallelism(50) //设置并发量
    b.RunParallel(func(pb *testing.PB) {
        for pb.Next() {
            req()
        }
    })
    b.StopTimer()
}
go test -bench=. -run=none -benchmem -benchtime=5s -cpuprofile=cpu_profile.out
go tool pprof -http="127.0.0.1:8080" cpu_profile.out其他
记录一次实际分析case,从mac打包好代码发布到dev服务器,然后在dev服务器启动打包好的二进制,并且通过另外一个go项目压测。
在mac上执行时,必须先转成linux二进制文件
CGO_ENABLED=0 GOOS=linux GOARCH=amd64 go build然后按照上面的1/2/3/4步执行。可以在本地直接访问dev服务器,所以就可以这样:
go tool pprof http://192.168.98.10:6060/debug/pprof/profile\?seconds\=60
(pprof) web分析到最后,猜测是因为append切片时导致的问题。通过压测发现append的长度直接影响性能,长度差了一半,性能也就差了一半。那接下来的问题就是如何优化append操作。
可以在代码中用pprof的函数监控某个函数的使用时间,代码如下:
func main() {
  f, _ := os.OpenFile("cpu.profile", os.O_CREATE|os.O_RDWR, 0644)
  defer f.Close()
  pprof.StartCPUProfile(f)
  defer pprof.StopCPUProfile()

  n := 10
  for i := 1; i <= 5; i++ {
    fmt.Printf("fib(%d)=%d\n", n, fib(n))
    n += 3 * i
  }
}
封装了pprof的包
runtime/pprof使用起来有些不便,因为要重复编写打开文件,开启分析,结束分析的代码。所以出现了包装了runtime/pprof的库:pkg/profile。pkg/profile的 GitHub 仓库地址为:https://github.com/pkg/profile。`pkg/profile`只是对`runtime/pprof`做了一层封装,让它更好用。使用`pkg/profile`可以将代码简化为一行。使用前需要使用`go get github.com/pkg/profile`获取这个库。
defer profile.Start().Stop()wrk压测
go 压测可以对比相同代码的处理性能,但是如果是两个方案的TPS/QPS对比,则Go压测是没办法直接做到。于是用wrk做压测。
wrk -t 1 -c 1 -d 1s --timeout 5s --latency  -s post.lua http://192.168.0.1:8000/xxx
# 参数调优
-t 服务器的CPU核数
-c 并发数量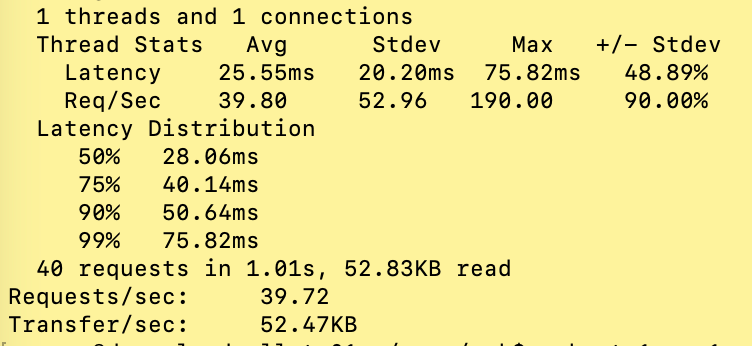
Running 30s test @ http://www.bing.com (压测时间30s)

  8 threads and 200 connections (共8个测试线程,200个连接)

  Thread Stats   Avg      Stdev     Max   +/- Stdev
              (平均值) (标准差)(最大值)(正负一个标准差所占比例)
    Latency    46.67ms  215.38ms   1.67s    95.59%
    (延迟)
    Req/Sec     7.91k     1.15k   10.26k    70.77%
    (处理中的请求数, Req/Sec * connections 是发送的请求数量)

  Latency Distribution (延迟分布)
     50%    2.93ms
     75%    3.78ms
     90%    4.73ms
     99%    1.35s (99分位的延迟:%99的请求在1.35s以内)
  1790465 requests in 30.01s, 684.08MB read (30.01秒内共处理完成了1790465个请求,读取了684.08MB数据)
Requests/sec:  59658.29 (平均每秒处理完成59658.29个请求)
Transfer/sec:     22.79MB (平均每秒读取数据22.79MB)
post.lua
wrk.method = "POST"

local reqURL = "http://192.168.98.10:8060/account/v2/action/bookkeeping/pg"
wrk.headers["Content-Type"] = "application/json"

local uuid = require("uuid")
function request()
    wrk.body = 'JSON'..uuid()..'JSON'
    return wrk.format('POST', reqURL, nil, body)
end
安装wrk
git clone --depth=1 https://github.com/wg/wrk.git wrk
cd wrk
make
// move the executable to somewhere in your PATH
sudo cp wrk /usr/local/bin
安装uuid:
luarocks install uuid然后在wrk包底下执行:
cp  /usr/local/share/lua/5.1/uuid_0_3_1-uuid.lua .
mv uuid_0_3_1-uuid.lua uuid.lua
然后就可以用uuid了!


 关于 LearnKu


